What is a good conversion rate for my app in 2026?
What is a good conversion rate for a mobile app? See the 2026 benchmarks, how freemium and hard paywall differ, and the levers that grow your revenue.

Article summary
- According to RevenueCat's State of Subscription Apps 2026 report, the median download → paid subscription conversion rate at 35 days is 2.1% for freemium apps, versus 10.7% for hard-paywall apps.
- These figures compare different apps. They do not measure the effect of an experiment on the same product.
- On Mukiz, for example, we raised the iOS conversion rate from 1.55% to 3.05%, while multiplying 30-day LTV by 3, in less than six months.
- The conversion rate alone is therefore not enough to decide which app has the better monetization.
- The real challenge is to identify the experiments that can durably improve the revenue generated by your users.
Summarize this article with
Your app converts 2%, 3%, or 5% of its downloads into paid subscribers. Is that a good result?
The answer depends on your monetization model, your category, and how you measure conversions.
According to RevenueCat's State of Subscription Apps 2026 report, the median download → paid subscription conversion rate at 35 days is 2.1% for freemium apps, versus 10.7% for hard-paywall apps.
Knowing the market averages is not enough.
What actually matters is understanding why your app sits above or below these benchmarks, and identifying the experiments that can improve its revenue.
At firstapp, we help mobile apps do that work.
On Mukiz, for example, we raised the iOS conversion rate from 1.55% to 3.05%, while multiplying 30-day LTV by 3, in less than six months.
Here is how to read your performance and find your next growth levers.
1. What is the average conversion rate of a mobile app in 2026?
The Download-to-Paid conversion rate measures the share of users who download an app and become paid subscribers.
It is calculated like this:
Conversion rate = (number of new paid subscribers / number of downloads) × 100
For a rigorous comparison, downloads and subscriptions must belong to the same cohort, with a defined conversion window.
Freemium vs hard paywall: the 2026 benchmarks
According to RevenueCat, median performance varies sharply by monetization model.
| Model | Median conversion at D35 |
|---|---|
| Freemium | 2.1% |
| Hard paywall | 10.7% |
Source: RevenueCat, State of Subscription Apps 2026.
A hard paywall requires users to start a free trial or subscribe before they can use the core of the app.
A freemium app, by contrast, offers some features for free, with the option to unlock premium features.
Hard-paywall apps show a median conversion about five times higher than freemium apps.
That does not mean switching your app to a hard paywall will automatically multiply conversions by five.
These figures compare different apps. They do not measure the effect of an experiment on the same product.
The right model depends in particular on perceived value, user behavior, and the role of the free features.
Our approach at firstapp: the monetization model should be a hypothesis to test, not a final decision made at launch.
Newsletter
Once a week.
Last issue
We opened 10 apps to see how they sell a subscription.
+534 people read us each week
2. Is a 3% conversion rate good?
For a freemium app, a Download-to-Paid rate of 3% at D35 is above the 2.1% median observed by RevenueCat.
For a hard-paywall app, the same result is below the 10.7% median.
Context completely changes the reading.
The three criteria to take into account
1. Your app's category
A fitness app, an education app, and a mobile game do not answer the same needs.
Their users do not necessarily share the same purchase intent, the same frequency of use, or the same perception of value.
Comparing their conversions without accounting for those differences can lead to poor decisions.
2. The geographic market
Purchase behavior varies by country.
A global benchmark does not necessarily represent the performance you should expect on the French market.
Prefer relevant geographic comparisons when the data is available.
3. The monetization model
An app that offers only an annual subscription does not show the same conversion behavior as an app that offers weekly, monthly, and annual subscriptions.
The offer structure influences conversion, initial cash collected, and retention.
Why conversion is not enough
Imagine two apps that each record 10,000 downloads.
The first converts 5% of its users with a subscription at €2.99 per month.
The second converts 3% with a subscription at €9.99 per month.
The first gets more subscribers, but the second can generate more revenue.
The conversion rate alone is therefore not enough to decide which app has the better monetization.
You also need to look at revenue per install, retention, and LTV.
3. firstapp client story: Mukiz nearly doubles its iOS conversion and triples its 30-day LTV
Benchmarks place an app in its market.
They do not tell you how to improve performance.
Take Mukiz, a mobile app that mixes music and gaming, which firstapp supported on monetization.
In less than six months, we saw two major shifts on iOS.
What we see in practice
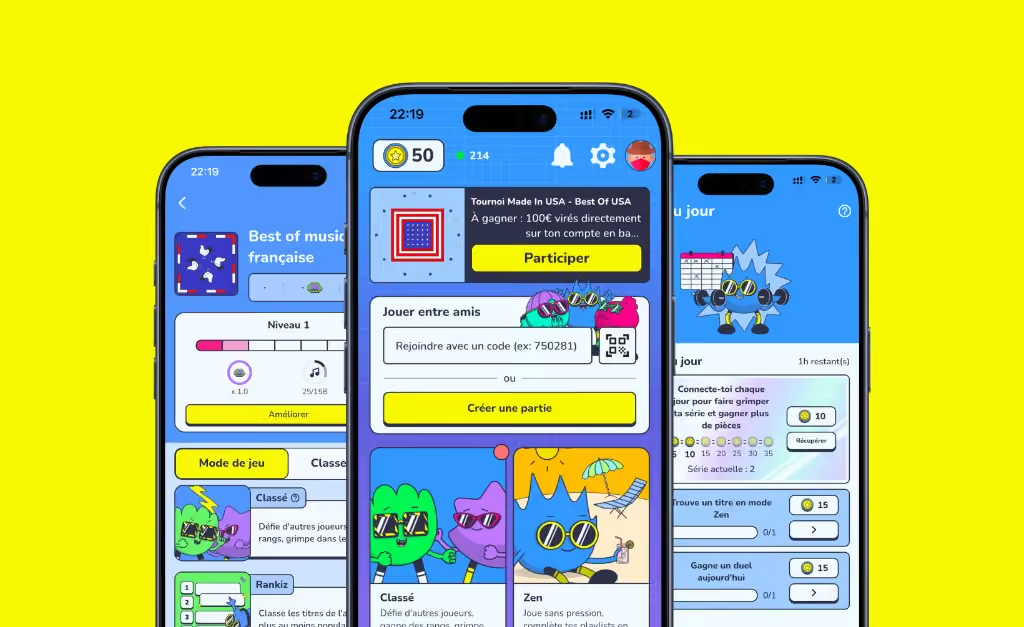
Download-to-Paid conversion moved from 1.55% to 3.05%
| iOS metric | Before | After |
|---|---|---|
| Download-to-Paid | 1.55% | 3.05% |
| Relative change | - | +96.8% |
| Change in points | - | +1.50 points |
Mukiz nearly doubled its download → paid subscription conversion rate on iOS.
To see what that progression represents, take a theoretical base of 10,000 downloads.
At a conversion rate of 1.55%, the app generates about 155 paid subscribers.
At a conversion rate of 3.05%, it generates about 305.
That is 150 additional paid subscribers per 10,000 downloads, at a comparable volume and under comparable conditions.
And that, in this example, without needing to increase the number of downloads.
30-day LTV multiplied by three
Over the same period, iOS 30-day LTV measured by cohort in RevenueCat was multiplied by three.
LTV (Lifetime Value) is the economic value generated by a user over their relationship with the app, according to the definition used by the measurement tool.
In our analysis, we use a fixed 30-day window.
In other words, we compare the value generated during the first 30 days by the user cohorts we studied.
That distinction matters.
A 30-day LTV should not be confused with an estimate of a user's total value over their entire lifetime.
Why these two results are interesting
The improvement in conversion and the improvement in LTV do not measure the same thing.
- Download-to-Paid measures the ability to turn downloads into paid subscribers.
- 30-day LTV measures the value generated per user during their first 30 days, within the scope of the RevenueCat metric.
An app can raise its conversion by cutting prices sharply, without necessarily improving revenue per user.
A price increase, conversely, can raise the value of subscribers while lowering the conversion rate.
In Mukiz's case, both indicators moved up during the engagement.
That is exactly what we look for at firstapp: improve conversion while increasing the economic value generated by users.
Mukiz's results show why it is worth steering monetization as a whole, rather than focusing only on a paywall's conversion rate.
Methodology: results observed on iOS in less than six months. Conversion is Download-to-Paid. 30-day LTV is calculated by cohort in RevenueCat. Cohorts need a full 30-day observation window to be compared rigorously. These shifts, on their own, do not make it possible to attribute each improvement causally to one particular experiment.
4. Why doesn't your app convert more?
When an app underperforms, the first reflex is often to change the paywall.
Change the colors, add a promotion, change the prices, or test a new layout.
The problem can sit much earlier.
At firstapp, we look at the whole user journey to see where the main conversion losses are.
Step 1: Download → Paywall Viewed
What share of users who download your app actually see your paywall?
Imagine that only 40% of downloads reach the subscription screen.
That means 60% of users never discover your offer.
Before changing the paywall price or design, it can be more useful to look at onboarding, account-creation steps, or the moment the offer appears.
Step 2: Paywall Viewed → Trial Started
Among users who see your offer, how many start a free trial?
A low conversion rate can reveal several problems:
- A value proposition that is not clear enough.
- A price that is poorly presented.
- A poor understanding of the offer.
- A lack of trust.
- A gap between the expectations set by onboarding and the content of the paywall.
The goal is not to change all of these elements at once.
You need to form hypotheses, prioritize them, and measure their effects.
Step 3: Trial Started → Paid
How many users actually become paying after their free trial?
A large number of trials does not guarantee good monetization.
If users start a trial but cancel immediately, or never become paying, you need to understand why.
Is the product's value obvious enough? Did the user have time to discover the important features? Does the offer match their needs?
Step 4: Paid → Retention
How long do your subscribers stay active?
An app can show excellent initial conversion and lose its subscribers quickly.
That is why we also look at retention, renewals, cancellations, and LTV.
Our method is to identify the step that represents the largest revenue opportunity, then build the experiments around that priority.
5. Five experiments to improve an app's conversion rate
There is no universal test that works on every app.
Some experiments, though, are regularly worth considering.
1. Test paywall placement
Should the paywall appear immediately after onboarding, after account creation, or after a first successful action?
The right moment depends on how well the product's value is understood.
A user who has just seen, concretely, what the app can do for them may react differently from a user who has not tried anything yet.
2. Compare freemium and hard paywall
A freemium model can favor adoption, engagement, and word of mouth.
A hard paywall can speed up monetization for users who perceive the product's value immediately.
The choice should be guided by data.
Compare conversions, but also revenue per install and retention.
3. Optimize how subscriptions are presented
The order of offers, the emphasis on the annual subscription, and the price gaps can influence users' decisions.
For example, presenting an annual offer as the recommended option can change the subscription mix.
Raising the share of annual plans should not become an isolated goal.
Check that the shift actually improves revenue.
4. Test different free-trial lengths
Three, seven, fourteen, or thirty days?
Trial length can influence how many users start a trial and what share becomes paying.
A longer trial can leave more time to discover the product's value.
It can also delay cash collection, or attract users whose intent to pay is weaker.
Measure the whole journey, not only the trial-start rate.
5. Improve onboarding
A user who does not understand your app's value has little reason to subscribe.
Sometimes the best paywall optimization is to leave the paywall alone.
A better product demonstration, a personalized onboarding, or a first user success can improve perceived value before the offer is shown.
6. The metrics to track to improve monetization
To steer a subscription app well, it helps to track several complementary metrics.
| KPI | What it measures |
|---|---|
| Download-to-Paid | Conversion of downloads into paid subscribers |
| Download-to-Trial | Conversion of downloads into free trials |
| Paywall-to-Trial | Conversion of users exposed to the paywall |
| Trial-to-Paid | Conversion of trials into paid subscriptions |
| Revenue Per Install | Revenue generated per install over a defined period |
| 30-day LTV | Value generated per user during their first 30 days |
| Subscription retention | Ability to keep subscribers over time |
What matters is to define each metric precisely and to compare coherent cohorts.
A 7-day conversion rate should not be compared directly with a 35-day benchmark.
Likewise, a 30-day LTV should not be compared with an LTV estimated over 12 months.
Poorly defined metrics can lead to bad decisions, even when the dashboards look very precise.
Conclusion: do not aim only to beat the average
Benchmarks are useful for understanding where your app stands.
Being above average does not mean your monetization is optimal.
The real challenge is to identify the experiments that can durably improve the revenue generated by your users.
On Mukiz, our work came with an iOS Download-to-Paid move from 1.55% to 3.05% and a 30-day LTV multiplied by three, in less than six months.
These results show why it matters not to steer on conversion rate alone.
At firstapp, we help subscription apps generate more revenue per user through experimentation on onboarding, paywalls, and pricing.
Could your app generate more revenue from the users it already has?
7. FAQ: mobile app conversion rates
What is the average conversion rate of a mobile app in 2026?
According to RevenueCat, the median download → paid subscription conversion rate at 35 days is 2.1% for freemium apps and 10.7% for hard-paywall apps. These figures cover the subscription apps studied in the State of Subscription Apps 2026 report.
Is a 3% conversion rate good?
A Download-to-Paid rate of 3% at D35 is above the freemium median of 2.1%. It is below the hard-paywall median of 10.7%. The comparison should take the monetization model, the category, and the geographic market into account.
How do you improve an app's conversion rate?
Start by analyzing the full funnel: download, onboarding, paywall view, trial start, and paid subscription. Identify the main user losses, then test hypotheses on the user experience, pricing, and how the offer is presented.
What is the difference between conversion rate and LTV?
The conversion rate measures the share of users who take an action, such as subscribing. LTV measures the economic value generated by users over time. A 30-day LTV corresponds to a 30-day observation window and does not necessarily represent a user's total future value.
Does a hard paywall convert better than a freemium model?
In the RevenueCat 2026 data, hard-paywall apps show a higher median Download-to-Paid conversion at D35 than freemium apps: 10.7% versus 2.1%. That does not guarantee a hard paywall will perform better for every app. Revenue per install, retention, and user behavior also have to be taken into account.
Also read
Paywall conversion rate: the 2026 benchmarks by category
In 2026, a hard paywall converts at a 10.7% median, a freemium app at 2.1% (download-to-paid at D35, RevenueCat). The right rate depends on the model, the trial length, and the category.
Trial-to-paid for a mobile app: the rate that says the paywall promised too much
Trial-to-paid is the share of trials that become a payment. If it falls while trials rise, the paywall promised too much.
Realized LTV of a mobile app: reading a test once the money is collected
Realized LTV is the money already collected on a cohort, at a date. A projection can move without a single euro coming in.
How do you calculate a mobile app's conversion rate?
Divide the number of users who became paid subscribers by the number of downloads in the cohort you are studying, then multiply by 100. For a comparable measure, define a conversion window, for example 35 days after download.