15 experiments to increase your mobile app's revenue
You already have downloads, active users, and maybe even subscribers. But is your application actually generating as much revenue as it could?

Article summary
- What if your biggest growth opportunity was among the users you already have?
- That is 50% more subscribers, without increasing acquisition.
- The goal is not simply to convert more users. It is to increase the economic value generated by each of them.
- According to RevenueCat's State of Subscription Apps 2026 report, the median Download-to-Paid conversion rate at 35 days reaches 10.7% for applications with a hard paywall, versus 2.1% for freemium applications.
- Before acquiring more users, monetize the ones you already have better.
Summarize this article with
You already have downloads, active users, and maybe even subscribers. But is your application actually generating as much revenue as it could?
When a mobile application wants to increase its revenue, the first reflex is often to invest more in acquisition.
More ad campaigns. More TikTok content. More downloads.
Yet before spending more to attract new users, another question deserves to be asked:
What if your biggest growth opportunity was among the users you already have?
Take an application that generates 10,000 downloads per month.
With a Download-to-Paid conversion rate of 2%, it gets 200 new paying subscribers.
By moving to 3%, it gets 300 subscribers for exactly the same number of downloads.
That is 50% more subscribers, without increasing its acquisition.
And conversion is only one lever among others.
Pricing, free trials, how subscriptions are presented, and retention can also have a major impact on revenue.
At firstapp, we support B2C mobile applications in optimizing their monetization.
Here are 15 concrete experiments to consider to generate more revenue with your existing audience.
1. Why optimize monetization before increasing acquisition?
Increasing your advertising budget can potentially get you more users.
But if your application converts poorly, you mainly risk paying to send more traffic into a journey that underperforms.
Take two applications that each record 10,000 downloads.
| Indicator | Application A | Application B |
|---|---|---|
| Downloads | 10,000 | 10,000 |
| Download-to-Paid | 2% | 3% |
| New paying subscribers | 200 | 300 |
At identical acquisition, application B generates 100 extra subscribers.
But careful: a better conversion rate does not systematically guarantee more revenue.
If you improve your conversion by cutting your prices in half, the economic result can be disappointing.
That is why you also have to track revenue per install, retention, and LTV.
The goal is not simply to convert more users. It is to increase the economic value generated by each of them.
Newsletter
Once a week.
Last issue
We opened 10 apps to see how they sell a subscription.
+534 people read us each week
2. Five experiments to optimize your paywalls
The paywall is one of the most important screens for a subscription application.
Yet optimizing it is not limited to changing a button color or adding a discount.
Experiment 1: test a hard paywall against a freemium model
Hypothesis: limiting free access can increase the share of users who become paying subscribers.
A freemium model lets people use part of the application for free.
A hard paywall asks the user to start a trial or subscribe to access the core of the product.
According to RevenueCat's State of Subscription Apps 2026 report, the median Download-to-Paid conversion rate at 35 days reaches 10.7% for applications with a hard paywall, versus 2.1% for freemium applications.
But these figures do not mean a hard paywall will automatically be more profitable for your application.
A freemium model can favor engagement, retention, or word of mouth.
Test: compare the two models on equivalent cohorts.
Measure: Download-to-Paid, revenue per install, and retention.
Experiment 2: change when the paywall is shown
Hypothesis: presenting the subscription at the moment the user perceives the product's value best can improve conversion.
Some applications show their paywall immediately after onboarding.
Others wait until the user completes a first important action.
For example, a nutrition application can show its paywall after generating a first personalized program.
The user then has a more concrete picture of what they could get by subscribing.
But delaying the paywall can also reduce the number of users who see it.
You therefore have to measure the whole funnel.
Test: paywall immediately after onboarding versus paywall after a first product experience.
Measure: paywall exposure, Download-to-Paid, and revenue per install.
Experiment 3: test a paywall across several screens (multi-step)
Hypothesis: presenting a subscription's benefits progressively can improve understanding of the offer and increase conversions.
A classic paywall generally concentrates the benefits, the prices, and the subscribe button on a single screen.
A multi-step paywall offers a more progressive journey:
- Present the application's main benefit.
- Strengthen perceived value with personalized arguments and reassurance elements.
- Present the offers and the subscriptions.
The goal is not simply to add screens, but to build a logical progression toward the purchase decision.
Concrete case: Ainoha, guiding the user toward the subscription
At firstapp, we support Ainoha, an application dedicated to perimenopause, in optimizing its monetization journey.
One line of work is to better understand how users discover the product's value before they are offered a subscription.
We are exploring in particular the value of a more progressive journey, in which the benefits are presented step by step rather than concentrated on a single screen.
The first observations of the user journey suggest that the way people discover and experience the product can play an important role in engagement.
That is exactly what we are trying to evaluate with a multi-step approach: not simply selling a subscription, but helping the user understand why they might need one.
This approach remains a hypothesis to validate by experiment, and not a guarantee of higher conversion.
What we see in practice
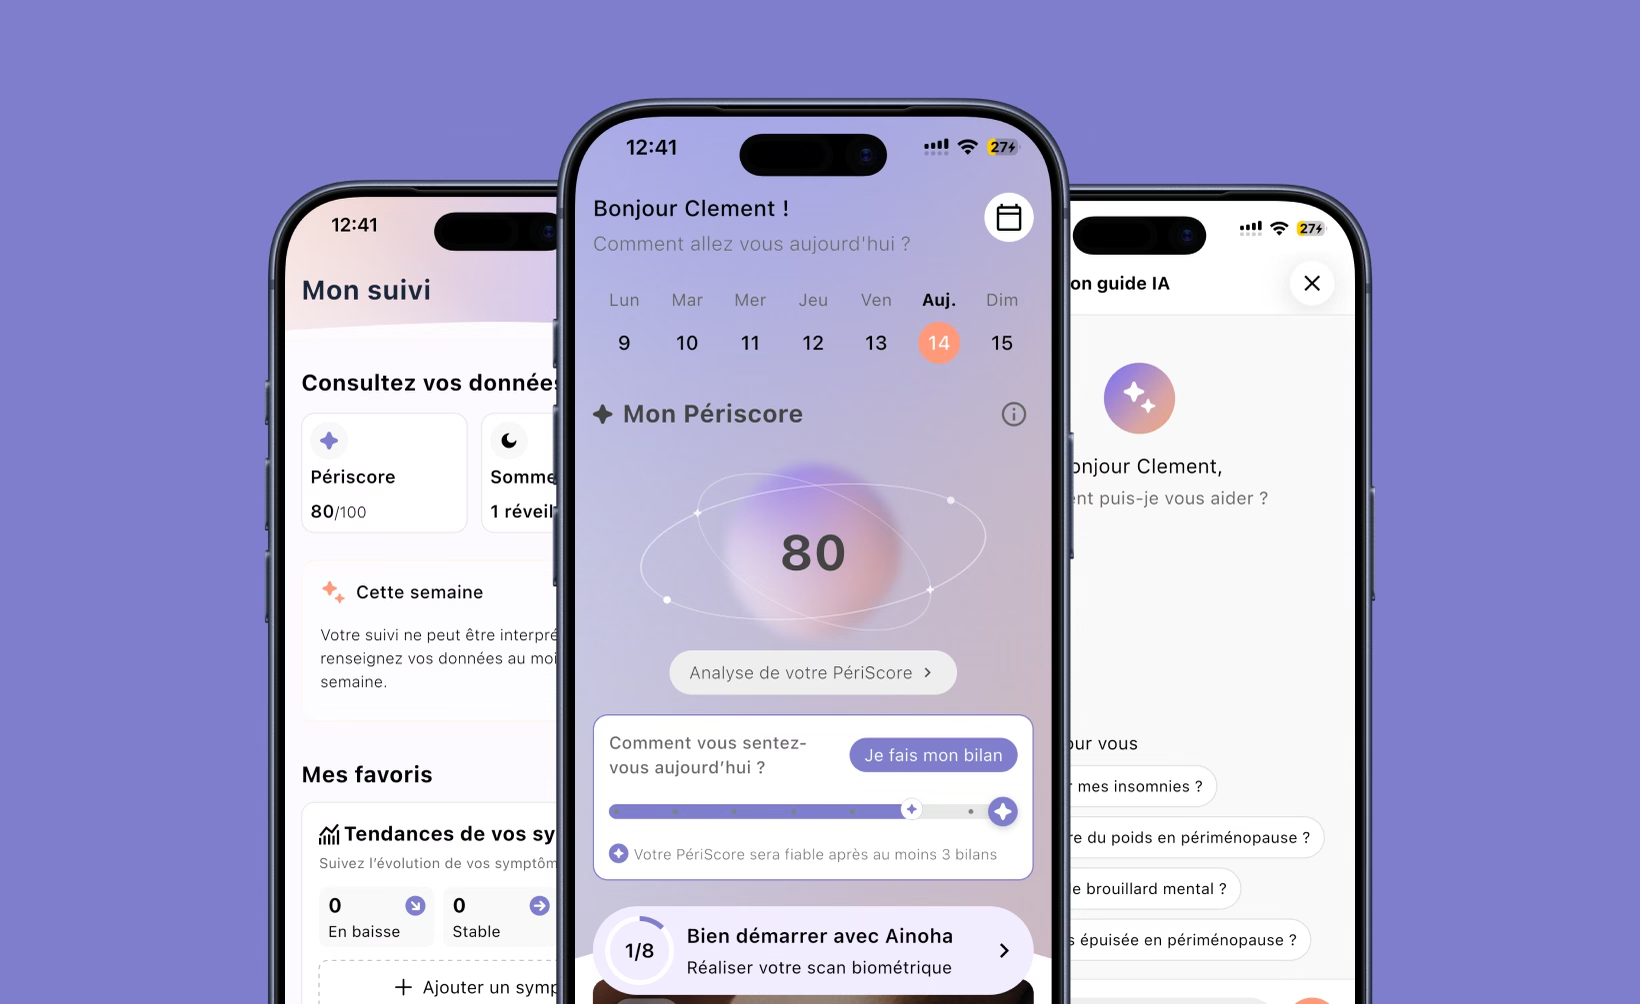
Measure: progression between screens, paywall conversion, Download-to-Paid, and revenue per install.
Experiment 4: personalize the paywall according to the user profile
Hypothesis: a paywall adapted to the user's needs can convert better than a generic presentation.
Imagine a fitness application.
One user wants to lose weight, another wants to gain muscle, and a third wants to improve endurance.
Why present them with exactly the same arguments?
Onboarding can identify users' goals, then adapt the benefits presented on the paywall.
This is not necessarily about changing the prices, but about communicating the product's value better.
Test: generic paywall versus paywall personalized according to the user's goal.
Measure: conversion and revenue per user, by segment.
Experiment 5: simplify the presentation of your offer
Hypothesis: reducing the amount of information and improving its hierarchy can make the purchase decision easier.
Some paywalls contain too many elements: several offers, many benefits, promotions, and reassurance messages.
The user has to quickly understand what they get, how much they pay, and why the offer fits them.
Test a simpler version, organized around one main promise and a clearly identifiable offer.
Test: current paywall versus a variant with a simplified visual hierarchy.
Measure: paywall conversion and revenue per install.
3. Four experiments to optimize your pricing
Pricing is often one of the most underused levers in mobile applications.
Yet a change in price or in how subscriptions are presented can influence revenue directly.
Experiment 6: put the annual subscription further forward
Hypothesis: presenting the annual as the recommended offer can increase its share of new subscriptions.
Many applications offer a monthly plan and an annual plan, with no real hierarchy.
Yet the annual can present several economic advantages, notably a larger initial cash collection.
You can test:
- An annual offer selected by default.
- A "Best offer" badge.
- A clear comparison of the savings.
- A presentation of the monthly equivalent of the annual price.
The billing conditions must stay explicit.
Measure: monthly/annual split, revenue per install, and LTV.
Experiment 7: raise your prices
Hypothesis: your audience can accept a higher price without a possible drop in conversion wiping out the revenue gain.
Imagine an application with a monthly subscription at €7.99.
You test a price of €9.99.
Even if your conversion rate falls slightly, you can potentially generate more revenue.
Take a theoretical example with 1,000 users exposed to each offer:
| Indicator | Price at €7.99 | Price at €9.99 |
|---|---|---|
| Paid conversion | 10% | 9% |
| New subscribers | 100 | 90 |
| First gross monthly payment | €799 | €899.10 |
In this example, the higher price generates about 12.5% more gross revenue on the first monthly payment, despite a lower conversion.
That says nothing about renewals, refunds, commissions, or future revenue.
Measure: revenue per install, conversion, and retention.
Experiment 8: change the price gap between monthly and annual
Hypothesis: the price gap between the plans can influence users' preference.
If your annual subscription offers a saving that is not very significant, some users will prefer to stay on the monthly.
Conversely, a large annual discount can improve that plan's attractiveness, but reduce the revenue collected per subscription.
You therefore have to find a balance between conversion and economic value.
Test: different price structures and different levels of annual discount.
Measure: subscription mix, initial revenue, and LTV.
Experiment 9: adapt prices by country
Hypothesis: prices adapted to local markets can improve monetization.
An application sold in France, the United States, and Brazil is not addressing audiences with the same purchasing power.
Yet some applications apply almost identical prices everywhere.
Testing prices adapted to each market can answer users' willingness to pay better.
You have to take taxes, currencies, store rules, and the volume of available data into account.
Measure: conversion, revenue per install, and retention by country.
4. Three experiments to optimize your free trials
Free trials are often used to lower the barrier to subscription.
But their length and their presentation can have very different effects on revenue.
Experiment 10: test 3 days versus 7 days of free trial
Hypothesis: a longer trial can let users understand the product's value better.
A three-day trial can favor a fast decision.
A seven-day trial can leave more time to discover the important features.
But a longer trial does not guarantee a better paid conversion.
Test: three days versus seven days of trial.
Measure: Download-to-Trial, Trial-to-Paid, and revenue per install.
Experiment 11: test 7 days versus 30 days of free trial
Hypothesis: a longer trial length can be relevant for an application whose value builds progressively.
An educational application, for example, can require several sessions before the user fully perceives its interest.
A 30-day trial can therefore be interesting to explore.
But careful: it also delays the first payment.
To compare the variants correctly, you have to wait until the cohorts have had time to finish their trial and become paying.
Measure: paid conversion, revenue per install over a comparable horizon, and retention.
Experiment 12: improve activation during the trial
Hypothesis: a user who quickly discovers the product's value during their trial may be more likely to become paying.
Rather than only changing the trial length, you can work on what happens after it starts.
For example:
- Encourage a first important action.
- Personalize the recommendations.
- Present a relevant feature at the right moment.
- Send a useful reminder when the user has not finished their setup.
Measure: activation, Trial-to-Paid, and retention.
5. Three experiments to improve retention and LTV
An application can convert its users very well and still lose a large share of its subscribers after a few weeks.
Optimizing monetization therefore does not stop at the first payment.
Experiment 13: test a retention journey at cancellation
Hypothesis: offering an alternative adapted to the cancellation reason can keep some subscribers.
A user wants to cancel because they find the subscription too expensive?
A less expensive plan may suit them.
Another no longer uses the application?
Support to rediscover the features may be more relevant.
The goal is not to block cancellation, but to offer a useful alternative when it is possible, without making cancellation harder.
Measure: incremental retention, revenue kept, and satisfaction.
Experiment 14: offer an upgrade
Hypothesis: some subscribers can accept paying more when their use of the product evolves.
This experiment mainly concerns applications that offer several subscription tiers.
For example, a productivity application can offer a premium plan with advanced features to its most engaged users.
The higher offer has to bring real value that is clearly identifiable.
Measure: upgrade rate, average revenue per subscriber, and retention.
Experiment 15: test personalized re-engagement messages
Hypothesis: a relevant message sent at the right moment can encourage a user to come back to the application.
A fitness application can remind them of a recent progression.
An educational application can offer a new session adapted to the user's level.
A nutrition application can encourage them to continue a goal started a few days earlier.
The idea is not to send more notifications, but to send more useful messages.
Measure: incremental reactivation, retention, and revenue.
6. How do you know which experiments to launch first?
You now have 15 ideas.
But that does not mean you should launch 15 tests.
The right starting point is to understand where your application loses the most value.
Analyze your monetization funnel
For a subscription application, the journey can be represented like this:
Download → Onboarding → Paywall → Trial → Paid → Retention
Each step is an optimization opportunity.
| Observed problem | Experiments to consider |
|---|---|
| Few users reach the paywall | Paywall placement, onboarding |
| Many see the paywall, few start a trial | Value proposition, multi-step, pricing |
| Many start a trial, few become paying | Trial length, activation |
| A high share of monthly subscriptions | Annual presentation, price structure |
| Good conversion, but low revenue | Price, subscription mix, upgrade |
| Lots of cancellations | Retention, product experience, re-engagement |
These correspondences are lines of investigation, not automatic diagnoses.
Measure revenue, not only conversions
An experiment can increase your paywall conversion while decreasing revenue.
For example, a large price cut can convince more users to subscribe, but reduce the average revenue generated by each subscription.
That is why we recommend tracking several complementary indicators:
- Download-to-Paid: share of downloads turned into paying subscribers.
- Trial-to-Paid: share of free trials turned into paid subscriptions.
- Revenue Per Install: revenue generated per install over a defined period.
- LTV: economic value generated per user over a given horizon.
- Retention: the ability to keep users and subscribers over time.
The choice of the primary metric depends on the hypothesis being tested.
An experiment on price should not necessarily be judged with the same criteria as an experiment on onboarding.
Do not change everything at the same time
Changing the price, the trial length, the design, and the paywall placement at the same time makes the results harder to interpret.
If the new variant wins, you will know the overall effect of that combination, but not necessarily the contribution of each change.
A good experiment has to answer a clear question.
Our principle at firstapp: each test has to make it possible to take a better decision on the application's monetization.
Conclusion: before acquiring more users, monetize the ones you already have better
Increasing your acquisition budget can accelerate an application's growth.
But if your onboarding, your paywall, or your pricing underperform, you mainly risk amplifying an existing problem.
Monetization optimization lets you work on the revenue generated by the users you have already acquired.
And contrary to what one might think, the opportunities are not only on the paywall.
They can sit in how you present your subscriptions, the length of your free trials, your pricing strategy, or your ability to keep your users.
At firstapp, we help subscription applications generate more revenue per user through experimentation on onboarding, paywalls, pricing, and retention.
Want to identify the next experiments to launch on your application?
FAQ: increasing a mobile application's revenue
How do you increase an application's revenue without increasing downloads?
You can improve conversion of existing users, optimize prices, change how subscriptions are presented, test free trials, and work on retention. The goal is to increase the revenue generated per install and the value of users over time.
What is the best A/B test for a paywall?
There is no universal test. The best test depends on your main monetization problem. An application whose users do not see the paywall should first analyze its journey, while an application with many views but few purchases can test its offer or its value proposition.
Should you favor the monthly or the annual subscription?
The annual subscription can improve initial cash collection. The monthly can be more accessible for some users. The best strategy depends on the product, the prices, retention, and purchase behavior.
How long does it take to measure an A/B test?
It depends on traffic, conversion volume, and the primary metric. Some tests can produce usable results quickly, while experiments on free trials, retention, and LTV need more time.
Which metric should you prioritize to improve monetization?
Revenue per install over a fixed horizon is often a relevant indicator, because it takes both conversion and the revenue generated into account. It should be completed by LTV, retention, and the indicators specific to the experiment.
Also read
12 paywall mistakes that cost your mobile application revenue
Your paywall may be the most profitable screen in your application. Yet a few mistakes in design, pricing, or positioning can cost you subscribers every day.

What is a good conversion rate for my app in 2026?
What is a good conversion rate for a mobile app? See the 2026 benchmarks, how freemium and hard paywall differ, and the levers that grow your revenue.
Realized LTV of a mobile app: reading a test once the money is collected
Realized LTV is the money already collected on a cohort, at a date. A projection can move without a single euro coming in.