Mobile app trends 2026: the 10 figures redefining the market
The RevenueCat 2026 report covers 115,000 apps and $16 billion in revenue. Launches went from 2,000 to 14,700 new apps a month between January 2022 and January 2026.

Article summary
- New apps went from 2,000 a month in January 2022 to 14,700 in January 2026, seven times more in four years.
- The top 10% shows +306% MRR growth, the median +5.3%, and the bottom quartile −33%.
- The hard paywall converts at 10.7% download-to-paid at D35, freemium at 2.1%, with almost identical one-year retention.
- 82% of trial starts happen on the day of install. 55% of cancellations on 3-day trials also happen on D0.
- Apps launched before 2020 capture 69% of subscription revenue. Those launched in 2025 or later capture 3%.
Summarize this article with
RevenueCat has just published its 2026 report on subscription apps: 115,000 apps analyzed, $16 billion in revenue, more than 1 billion transactions. firstapp unpacks the 10 trends that will affect your app this year.
The market in figures
Before the trends, the context. The RevenueCat 2026 report is built on the real data of more than half of the world's mobile subscription apps. It is not a survey. It is a direct measure of what is happening in the stores.
Newsletter
Once a week.
Last issue
We opened 10 apps to see how they sell a subscription.
+534 people read us each week
The 10 trends redefining the market in 2026
Trend 1: The explosion of supply, 14,700 new apps a month
2,000 new apps/month in January 2022 → 14,700 in January 2026. That is 7x in 4 years.
Vibe coding and AI-assisted development tools have removed the main barrier to entering the market: the cost of development. What a team of 5 people used to take 6 months to build, a single founder can now ship in a few weeks.
The result: the App Store and Google Play are flooded with new apps. User demand has not kept the same pace. There are more apps than ever, and less attention available for each one.
What this means for you, building an app is no longer a competitive advantage. Distribution, acquisition, and retention are. The founder who focuses only on the product in 2026 arrives in a market that is not waiting for them.
Trend 2: Revenue polarization, the middle disappears
Top 10%: +306% MRR growth. Median: +5.3%. Bottom 25%: -33%.
The app market in 2026 looks more and more like a winner-takes-most economy. The best-optimized apps, onboarding, paywall, retention, grow exponentially. The rest fight over scraps.
What is particularly alarming: it is not the bottom of the market that suffers most. It is the middle. "Fine" apps that run without real optimization see their market share erode in favor of the best, and at the expense of their survival.
Being at the median in 2026 means being in danger. 5% growth when the leaders do +306% is falling behind in relative terms. There is no comfort zone in the middle anymore.
What this means for you, "Good enough" is no longer enough. Every optimization lever - onboarding, paywall, reviews, ASO - is no longer optional. It is what separates the apps that survive from the ones that stall.
Trend 3: The hard paywall crushes freemium, the myth is dead
Hard paywall: 10.7% download-to-paid conversion at D35. Freemium: 2.1%. That is a 5x gap.
The myth of freemium as a "safe" model for launching an app is definitively buried by the RevenueCat 2026 data. The hard paywall converts 5 times better, with almost identical one-year retention. The fear that a hard paywall will "scare users off" is unfounded.
What the data confirms: mobile users in 2026 are subscription-savvy. They understand subscription models, they know how to judge a value proposition, and they are ready to pay if onboarding has shown them why it was worth it.
What this means for you, if you are still hesitating between freemium and a hard paywall, the data has answered. The question is not "which model?", it is "does my onboarding justify the hard paywall?" If yes, move to a hard paywall.
For more detail, here is a link to an article on how to choose the right monetization model.
Trend 4: D0 is the only moment that really matters
82% of trial starts happen on the day of install. 55% of cancellations on 3-day trials happen on D0.
The same first session that decides whether a user will start a trial also decides whether they will cancel it. RevenueCat 2026 confirms that D0 is the most critical moment in the entire user journey, and that most apps have not understood that yet.
Your 7-day trial is in reality a one-hour trial. If the user does not see your app's value in their first session, they will not come back to look for it in the days that follow.
What this means for you, onboarding is not a formality before the app. It is the app. Every minute spent optimizing the first session pays back more than any other optimization.
Here are the tips for reducing your cancellation rate
Trend 5: The short-trial paradox, everyone gets it wrong
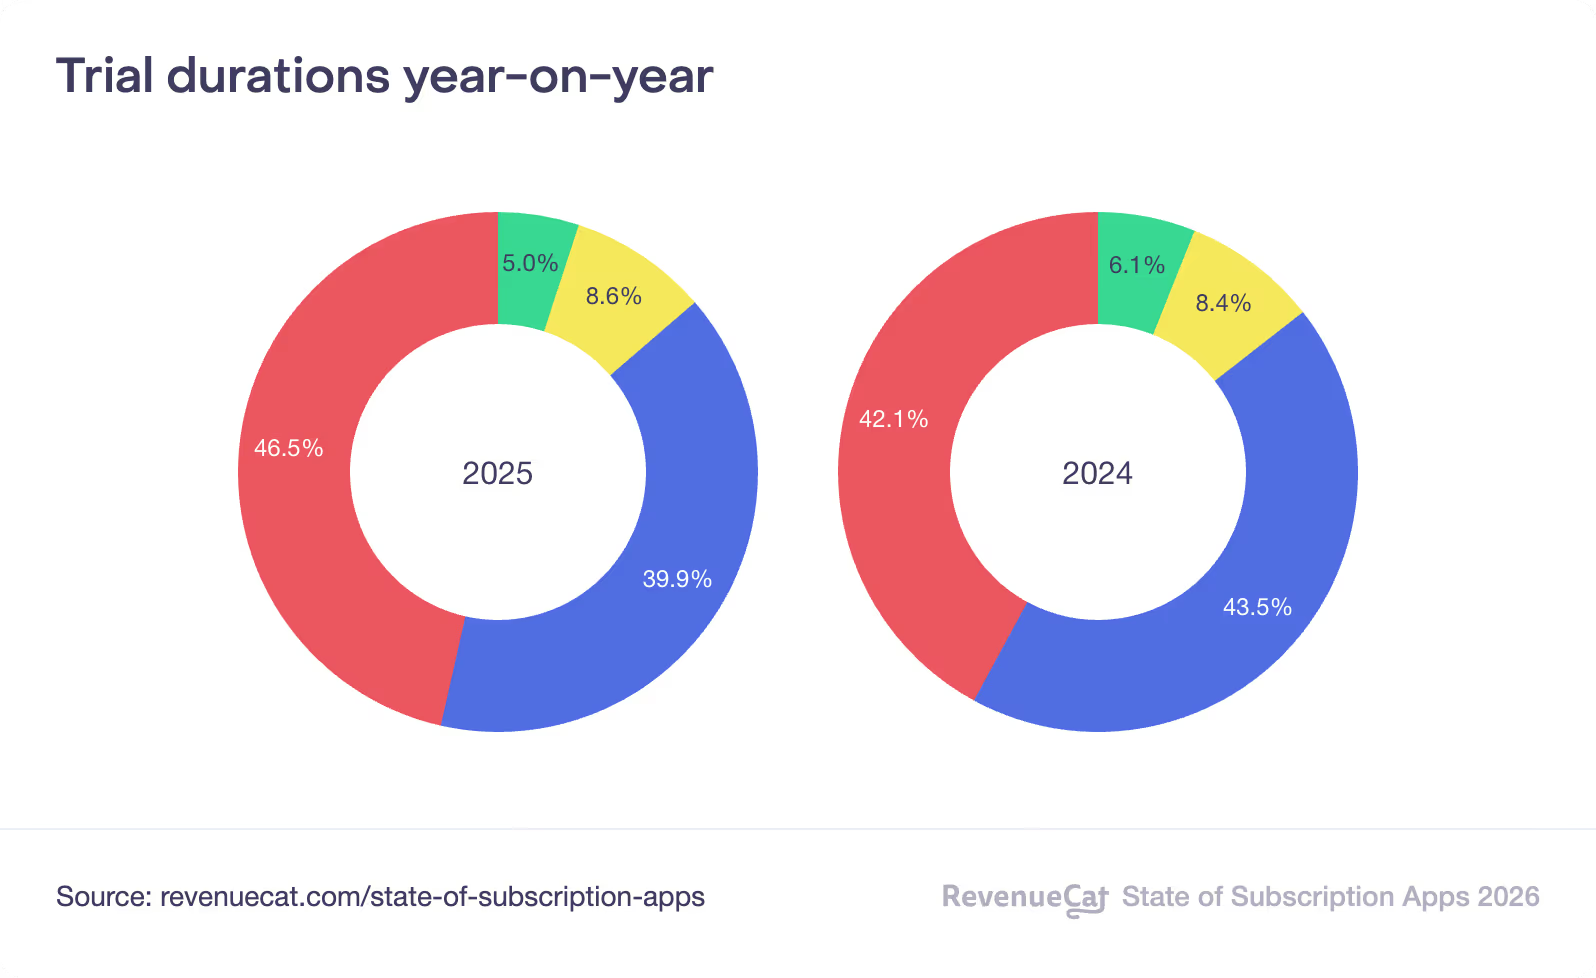
Trials of 17-32 days: 42.5% median conversion. Trials of ≤4 days: 25.5%. Yet 46.5% of apps use short trials.
This is one of the most striking paradoxes in the report. The data clearly shows that long trials convert 70% better than short trials. And yet, in 2026, the share of apps with trials of 4 days or fewer has increased compared with 2025.
Why? Founders shorten trials to "avoid cancellations by forgetfulness" and to get faster feedback. It is a calculation error: you sacrifice conversion quality for the cleanliness of short-term metrics.
What this means for you, test a longer trial. If your onboarding delivers value quickly, a 14- or 30-day trial will probably give you a better trial-to-paid conversion rate than a 3-day trial.
Trend 6: AI sells, but does not retain, yet
AI apps: +41% revenue per payer. But 12-month retention: 21.1% vs 30.7% for non-AI apps.
AI-powered apps generate more initial revenue. AI is a powerful magnet for curious users. But once inside the app, those users stay less long. Novelty attracts, but long-term value is not there yet for most AI apps.
27.1% of the apps in the RevenueCat 2026 dataset include AI. It is a structural trend, but it does not guarantee success if the product does not deliver continuous value beyond the initial wow.
What this means for you, AI in your app is an acquisition lever, not a retention lever. If you add it, make sure it delivers value that renews, not just a "wow" effect that fades after 2 weeks.
Trend 7: Google Play quietly loses 31% of its revenue
31% of cancellations on Google Play are due to billing errors. On the App Store: 14%.
This is the quietest and most expensive trend in the report. Nearly a third of cancellations on Google Play are not active decisions by users. They are failed automatic charges. Expired cards, insufficient funds, technical problems.
For Android apps, this is a direct opportunity: winning back these subscribers lost "involuntarily" with solid retry logic and grace periods can recover 15 to 20% of lost revenue without acquiring a single new user.
What this means for you, if you have an Android app, check your grace period and billing retry settings in RevenueCat or Google Play Console. It is the fastest optimization to put in place to recover lost revenue.
Trend 8: Old apps still dominate, and by a long way
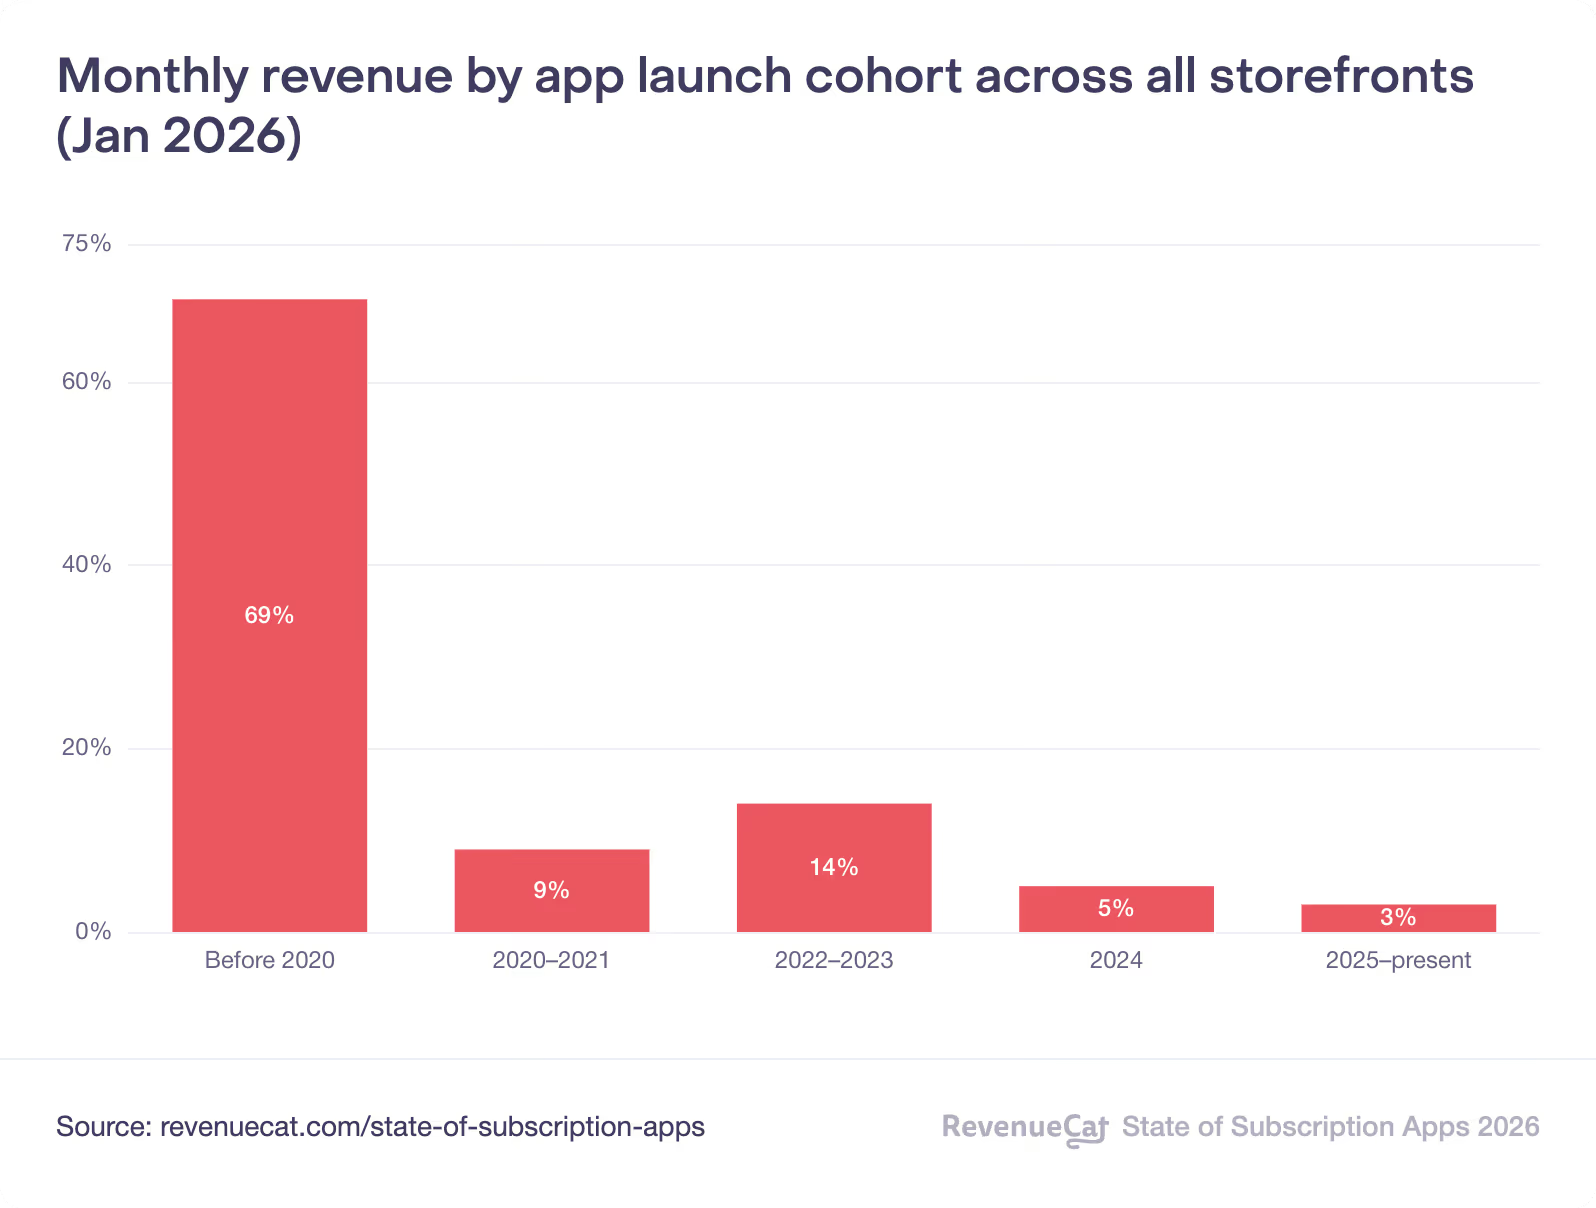
Apps launched before 2020: 69% of all subscription revenue. Apps launched in 2025+: 3%.
Despite the explosion of new apps, the great majority of revenue is still captured by apps launched before 2020. Established apps have a compounding advantage: a built audience, accumulated retention data, a practiced acquisition infrastructure.
For a new entrant in 2026, that means "doing better than the competitors" is not enough. You need real differentiation, on an unsolved problem, an unserved niche, or a significantly better experience.
What this means for you
Speed matters even more than before. Every month of delay at launch is a month in which you are not building the foundations that will make you a "profitable old app" in 5 years.
If you want to go further, here is an article on how to generate that first revenue in month 1.
Trend 9: Web-to-app is rising, a new source of revenue
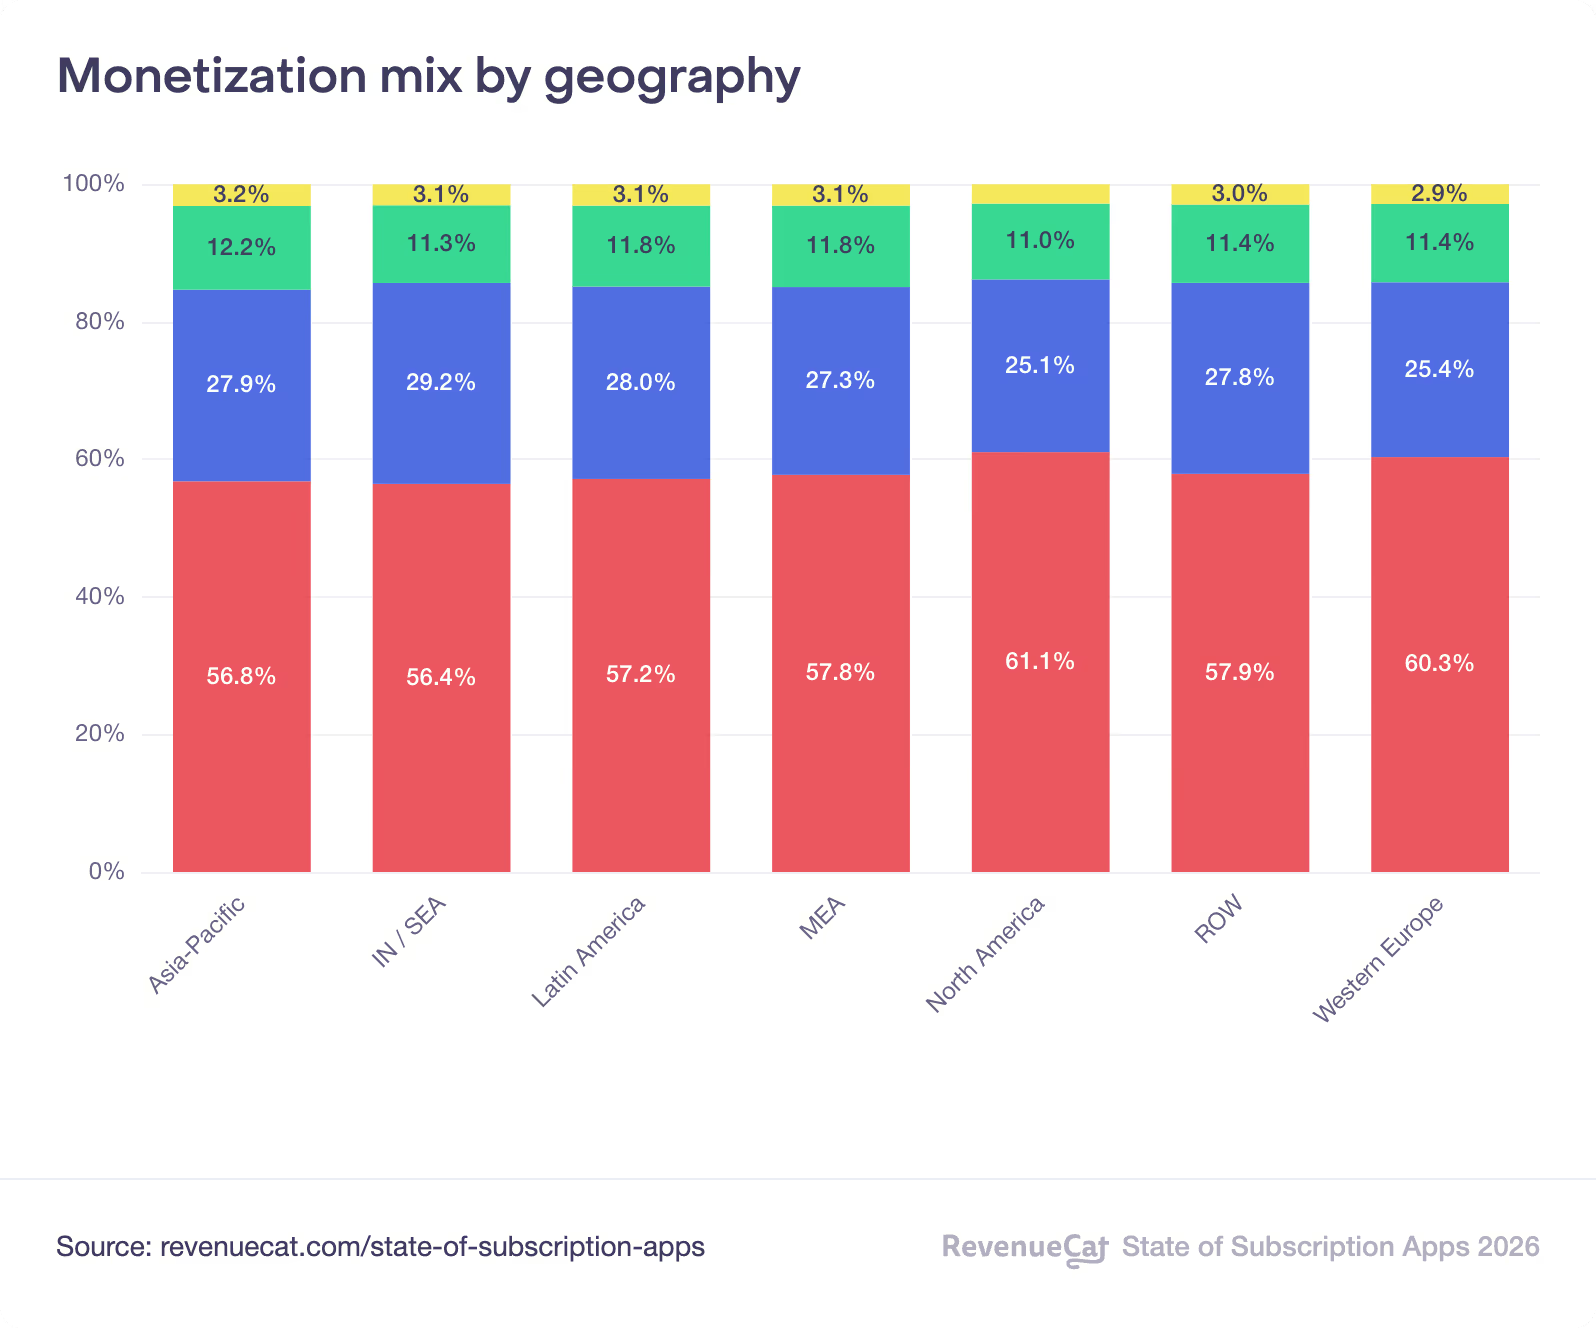
The web represents 3.2% of global revenue in the dataset, but 4.9% in North America, and it is growing fast.
More and more apps build dedicated web landing pages that let users subscribe directly in the browser, before downloading the app. The advantage: bypass Apple's commission (30%) on the first purchases, and reach users whose decision journey starts on Google, not in the App Store.
This is no longer a niche strategy. It is a structural trend that will accelerate with regulatory changes around store commissions.
What this means for you, having a landing page optimized for web subscription is an opportunity to investigate, especially if you already have organic SEO traffic. That is 30% additional revenue on web conversions.
Trend 10: Localization is the highest ROI, and nobody does it
12-month LTV: Switzerland $28.5 · Qatar $27.5 · United States $19.9. Localization = +62.3% LTV according to Adapty.
One of the most counterintuitive lessons in the report: localization, adapting prices and sometimes content to local markets, generates 62.3% additional LTV on average according to Adapty's data. It is the test with the best return on investment in the whole dataset.
And yet most apps adapt their prices to only a handful of markets, or not at all. Switzerland, Qatar, Israel: very high-LTV markets that many founders ignore completely in their pricing strategy.
What this means for you, before you test a new price on your main market, test localization on your top 5 international markets. It is probably the test that will move your revenue the most this year.
What the RevenueCat 2026 report changes
The RevenueCat 2026 report is reassuring on one point: the mobile subscription app market is not dead. It is in full health, for the apps that actually play the game.
But it is brutal on another: the era when a "fine" app could hold its ground without an optimization effort is over. The middle of the market is disappearing. Apps that do not actively progress, on their onboarding, their paywall, their retention, fall behind.
What the data confirms is exactly what we see with our clients: the founders who treat the product as a system to optimize continuously, not as a project to ship once, are the ones who end up in the top quartile. The others stall, or worse, see their MRR fall despite new users.
The 10 trends in the report all point to the same conclusion: in 2026, what makes the difference between an app that scales and an app that stalls is not the feature. It is execution on D0, the paywall, and retention. Those are exactly the three axes firstapp works on with its clients.
You want to apply these trends to your app, onboarding, paywall, retention, without handling it all alone? That is exactly what firstapp does with its clients, through our support.
FAQ
What does the RevenueCat 2026 report cover?
115,000 apps, $16 billion in revenue, and more than 1 billion transactions. The report measures more than half of mobile subscription apps, not a declarative survey.
Does the hard paywall convert better than freemium?
Yes in this report: 10.7% download-to-paid conversion at D35 for the hard paywall, versus 2.1% for freemium, five times more, with almost identical one-year retention. The question that remains is whether onboarding justifies that wall.
Why does day 0 matter so much?
82% of trial starts happen on the day of install. 55% of cancellations on 3-day trials happen the same day. A 7-day trial is, in practice, decided in the first session.
Do short trials convert better?
No. Trials of 17 to 32 days convert at 42.5% median, versus 25.5% for trials of 4 days or fewer. Yet 46.5% of apps still use a short trial. On Google Play, 31% of cancellations come from a billing failure, versus 14% on the App Store.
Also read
Paywall conversion rate: the 2026 benchmarks by category
In 2026, a hard paywall converts at a 10.7% median, a freemium app at 2.1% (download-to-paid at D35, RevenueCat). The right rate depends on the model, the trial length, and the category.

Mobile app retention rate: the 2026 benchmarks
The median annual retention of a subscription app is 28% in 2026, according to RevenueCat across 115,000 apps. It was 31% the year before.