Weekly vs annual: what the 2026 data says
In two years, weekly plans went from 43.3% to 55.5% of subscription revenue, and annual plans from 29.2% to 22.5%. The annual plan keeps 44.1% retention at 12 months, versus 3.4% for the weekly.

Article summary
- In two years, the weekly plan went from 43.3% to 55.5% of subscription revenue, the annual from 29.2% to 22.5%, and the monthly from 21.1% to 11.7% (Adapty, 16,000 apps).
- Weekly plans convert 1.7 to 7.4 times better than annual plans. The best aggregated LTV according to RevenueCat is the weekly with a 3-day trial, at 1.5 times the average.
- At 12 months, retention is 44.1% on annual, 17.5% on monthly, and 3.4% on weekly. An annual subscriber is 13 times more likely to still be active.
- Health and Fitness remains the exception: 60.6% of revenue comes from annual plans. Utilities is at 73.6% weekly, Productivity at 66%, gaming at 82%.
- Showing the annual plan pre-selected as a monthly cost increases trial starts by 30% and annual-plan adoption by 10% (RevenueCat).
Summarize this article with
Two years ago, annual plans generated 29.2% of mobile subscription revenue. In 2025, that figure fell to 22.5%. Over the same period, weekly plans went from 43.3% to 55.5% of the total.
This reversal is not an accident. It reflects a change in user behavior that the 2026 data documents precisely: users choose flexibility over savings. And the apps that followed that signal saw their revenue rise.
firstapp works with founders on monetizing their apps. The question "weekly or annual?" comes up in almost every project. The honest answer: both models work, but not for the same reasons, not in the same categories, and not with the same success metrics.
Here is what the data actually says.
The great reversal: weekly dominates in volume
The Adapty 2026 figures, built on 16,000+ apps and $3 billion in subscription revenue, are unambiguous on the trend.
In two years, the subscription-plan landscape has changed radically:
- Weekly: from 43.3% to 55.5% of total revenue
- Annual: from 29.2% to 22.5%
- Monthly: from 21.1% to 11.7%
Weekly has become the dominant plan. Monthly is in free fall. Annual is holding on, but receding.
Why the shift? Users have not changed their ability to pay. They have changed their relationship to risk. A weekly commitment perceived as reversible converts better than an annual commitment perceived as final, even if the total cost over 52 weeks is clearly higher than the annual plan. That is behavioral economics, not financial rationality.
Newsletter
Once a week.
Last issue
We opened 10 apps to see how they sell a subscription.
+534 people read us each week
Weekly plan: the documented advantages
Conversion
This is the main argument for the weekly plan: it converts. According to Adapty (State of In-App Subscriptions 2026), weekly plans convert 1.7 to 7.4 times better than annual plans, depending on the price band. The gap is structural and holds across every price tier.
The logic is simple. Faced with a weekly subscription at €7.49, the user evaluates a 7-day commitment. Faced with an annual subscription at €49.99, they evaluate a 365-day commitment. The psychological friction is not proportional to the price. It is proportional to the perceived length of the commitment.
Weekly plans also capture users who would never have crossed a hard paywall with an annual plan. These are often users with strong one-off intent: they have a precise problem to solve now, they are ready to pay now, but not to commit for a year.
LTV with a trial
Here is the most cited figure of 2025-2026 on this subject: the best 1-year LTV configuration in the RevenueCat SOSA 2026 data is the weekly plan with a 3-day trial. This configuration generates 1.5 times the average LTV of every other plan configuration.
It is not intuitive. You would expect an annual plan to generate more LTV per user. And that is true per user. But once you account for the volume of users captured thanks to the weekly plan's higher conversion, the aggregated LTV of the weekly with a trial beats that of the annual alone.
The worst configuration: the annual plan with no trial. Many apps still offer this model by default.
Annual plan: the documented advantages
Retention
This is the ground where the annual plan is not up for debate.
According to Airbridge (RevenueCat 2025 data, 75,000+ apps), 12-month retention by plan type is as follows:
- Annual: 44.1%
- Monthly: 17.5%
- Weekly: 3.4%
The difference between annual and weekly on 1-year retention is more than 40 points. This is not a marginal gap. A user who commits to an annual plan is 13 times more likely to still be active in 12 months than a user on a weekly plan.
The reason: status quo bias. A user who has paid 12 months in advance has a strong interest in using what they have already paid for. They are also less exposed to the renewal frictions that generate involuntary churn.
LTV per user
If you compare at a constant user base, the annual plan generates a structurally higher LTV per user. Airbridge notes that, with a constant price, the billing-duration choice alone creates an LTV gap of about 3x between annual and monthly.
Apps in the categories where annual dominates (Health & Fitness, Education, Travel) get a concrete advantage from it: users who last longer, reduced involuntary churn, and a shorter payback period on CAC.
Revenue predictability
An annual plan offers something the weekly cannot give: visibility. When a user pays €49.99 today, that revenue is recognized over 12 months. For an app that wants to steer its UA spend on the basis of predictable revenue, concentrating on annual simplifies financial modeling considerably.
The weekly and annual paradox
The two following statements are true at the same time:
- The weekly plan generates the best aggregated LTV (weekly + 3-day trial = 1.5x the average LTV)
- The annual plan generates the best retention (44.1% vs 3.4% at 12 months) and the best LTV per user
This paradox is explained by volume. The weekly, by converting 1.7 to 7.4 times better, brings enough additional users into the funnel for its aggregated LTV to exceed the annual's, even if each weekly user individually generates less revenue over time.
What that implies for your strategy: the question is not "weekly or annual?" but "what is my priority goal?". If you want to maximize conversion and volume, the weekly with a trial is your priority. If you want to maximize retention and revenue predictability, the annual should be the plan you put forward.
Most mature apps offer both, with an annual plan pre-selected and displayed as a monthly cost, to steer users without forcing them. According to RevenueCat, this configuration increases trial starts by 30% and annual-plan adoption by 10% compared with a paywall where the monthly is put forward. To go further on the structural decisions that come before this choice, plan structure is the third decision in the optimization order.
Weekly and annual by category
The choice between weekly and annual is not universal. Your app's category is one of the strongest determinants.
Health & Fitness: the annual exception
It is the only category where annual still clearly dominates, according to Adapty 2026: 60.6% of revenue comes from annual plans. Fitness and health apps answer a commitment to personal transformation. Users who start a fitness program commit to a duration, not to a week.
RevenueCat confirms: Health & Fitness shows the highest trial-to-paid rate of all categories (35%), which means the users who enter the funnel are already high-intent. An annual plan with a trial works particularly well in this context.
Utilities, Productivity, Entertainment: weekly reigns
Utilities: 73.6% of revenue on weekly (Adapty 2026). Productivity: 66%. Gaming: 82% according to RevenueCat 2026. In these categories, the app's value is immediate and one-off. The user has a problem to solve today. Weekly answers that intent without asking them to commit to a horizon they are not considering yet.
For productivity apps in particular, Adapty's data shows that direct buyers (with no trial) generate a 1-year LTV of $56.95 versus $49.13 for users on a trial. A signal that, in this category, intent is strong enough to consider a more direct paywall.
AI apps: a logic of their own
AI apps behave differently on this subject. They convert 2 times less well on trial than classic apps (5.3% vs 10.9%) but generate 41% more revenue per paying user. The best-performing configuration for AI apps remains the annual with a trial: €66.70 of LTV at 1 year versus €49.92 for the average of apps in the same configuration. To understand the full logic of AI app monetization, duration and plan type are key decisions.
Monthly: the forgotten plan
One line in the data deserves to be underlined: the monthly plan is in free fall.
11.7% of revenue in 2025, versus 21.1% two years earlier. In most categories, it underperforms both the weekly (on conversion) and the annual (on LTV and retention). It sits in an uncomfortable middle: neither flexible enough to attract the hesitant, nor committing enough to generate strong retention.
The only documented exception: Shopping and Media & Entertainment, where monthly spending habits are anchored in user behavior (Netflix, Spotify, and Amazon Prime have created a strong monthly reference in these categories).
In most cases, if your app still offers a monthly plan as the main option, that is an optimization opportunity. Replace it with a weekly, or demote it to a secondary option behind a featured annual.
FAQ
Is it better to offer a weekly or an annual plan for a mobile app?
Both, in most cases. The weekly converts 1.7 to 7.4 times better than the annual (Adapty 2026) and generates the best aggregated LTV when it is combined with a 3-day trial. The annual generates the best retention at 12 months (44.1% vs 3.4% for the weekly) and the best LTV per user. The optimal strategy is to offer both, with the annual displayed as a monthly cost and pre-selected, to steer without forcing.
Which plan generates the most revenue for a mobile app?
In total volume, the weekly plan represents 55.5% of mobile subscription revenue in 2025, versus 22.5% for the annual (Adapty 2026). In LTV per user, the annual is higher thanks to retention that is 13 times stronger at 12 months. The configuration with the best aggregated LTV according to RevenueCat SOSA 2026 is the weekly plan with a 3-day trial, which generates 1.5 times the average LTV of every other configuration.
Is the monthly plan still relevant in 2026?
Less and less. Monthly went from 21.1% to 11.7% of subscription revenue between 2023 and 2025 (Adapty 2026). In most categories, it underperforms the weekly on conversion and the annual on retention. The exceptions are Shopping and Media & Entertainment apps, where monthly payment habits are anchored. For the other categories, monthly should be a secondary option, not the main plan.
Are there app categories where annual remains dominant?
Yes. Health & Fitness is the only category where annual clearly dominates, with 60.6% of subscription revenue (Adapty 2026). Education and Travel also keep a high annual share. These categories share a trait: the user commits to a long-term transformation goal, not to a one-off solution. Annual matches that commitment horizon.
Also read
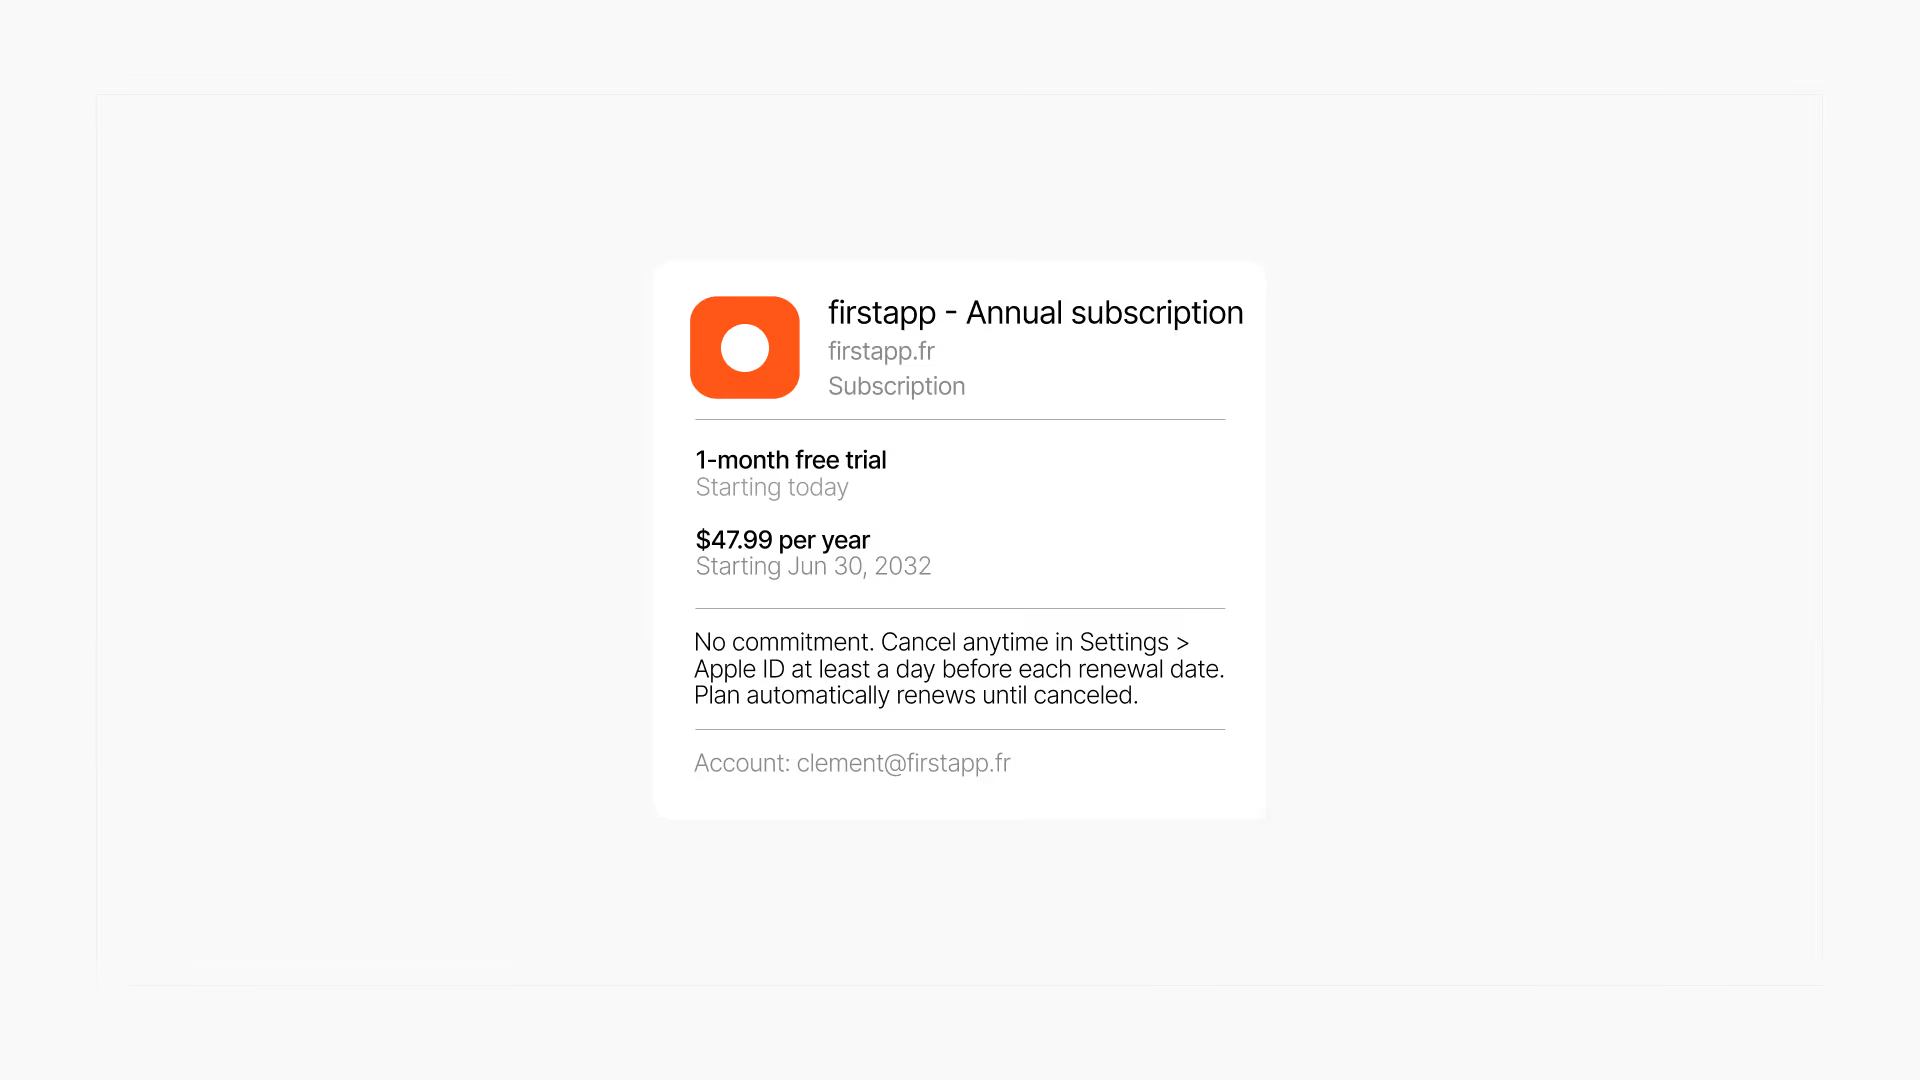
Monthly subscription with an annual commitment on the App Store: how it works
Since April 27, 2026, the App Store offers a subscription paid each month with a commitment over 12 installments. If the user cancels, the remaining payments stay due.

Mobile app monetization: the 5 models that work in 2026
A hard paywall converts at 10.7% download-to-paid at D35, a freemium at 2.1%. Founders who set the model before they code convert on average 2 to 3 times better.
How should you display plans on the paywall to maximize conversion?
Offer two plans maximum (weekly and annual), pre-select the annual displayed as a monthly cost, and mention the trial at every point of visual tension. According to RevenueCat, this presentation increases trial starts by 30% and annual-plan adoption by 10%. To go further on paywall structure, the 5 underestimated improvements cover the presentation levers in detail.