Mobile experimentation: our method for optimizing a B2C app
Mobile experimentation runs through seven steps: data, problem, hypothesis, prioritization, experiment, measurement, and learning. The goal is to learn faster, not to multiply tests.

Article summary
- Mobile experimentation runs through seven steps: data, problem, hypothesis, prioritization, experiment, measurement, and learning.
- Testing at random means optimizing a solution before you have identified the problem.
- Changing the paywall, the pricing, the onboarding, and the acquisition at the same time makes it impossible to know what produced the result.
- The speed of learning depends on the quality of the hypotheses, the speed of execution, and the quality of the measurement.
- Tests cover ASO, onboarding, the paywall, pricing, retention, and notifications, not only the payment screen.
Summarize this article with
A good mobile experimentation strategy rests on 7 steps:
| Step | Role |
|---|---|
| 01. Data | Understand what is happening |
| 02. Problem | Identify where it gets stuck |
| 03. Hypothesis | Understand why |
| 04. Prioritization | Choose what to test |
| 05. Experiment | Build the test |
| 06. Measurement | Measure the real impact |
| 07. Learning | Turn the result into the next test |
The goal is not to run more tests. The goal is to learn faster.
Two mobile experimentation mistakes
❌ 01 - They test at random
A competitor ships a new paywall → we copy it.
A conversion drops → we change the pricing.
A designer proposes a new version → we test it.
⚠️ Warning : We optimize a solution before having identified the problem.
❌ 02 - They test everything at the same time
New paywall.
New pricing.
New onboarding.
New acquisition.
Then: Revenue +18%
⚠️ Warning : We may get a result. But we do not know what caused it.
Newsletter
Once a week.
Last issue
We opened 10 apps to see how they sell a subscription.
+534 people read us each week
What is mobile experimentation?
Mobile experimentation means using data, hypotheses, and controlled experiments to gradually improve an app.
It can include A/B testing, but not only that.
An experiment can cover:
- ASO;
- onboarding;
- the paywall;
- pricing;
- offers;
- conversion;
- retention;
- notifications;
- the post-payment journey.
The principle stays the same:
Observe → understand → hypothesize → experiment → measure → learn.
The goal is not simply to find a variant that converts better.
The goal is to understand why it converts better, and to use that learning to decide the next test.
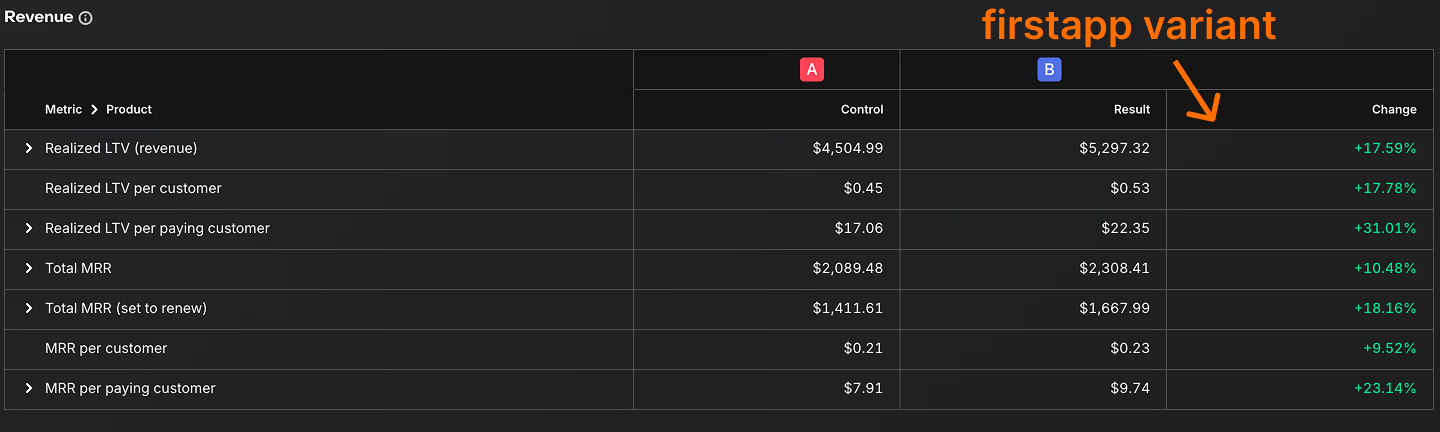
The result when it is done well:
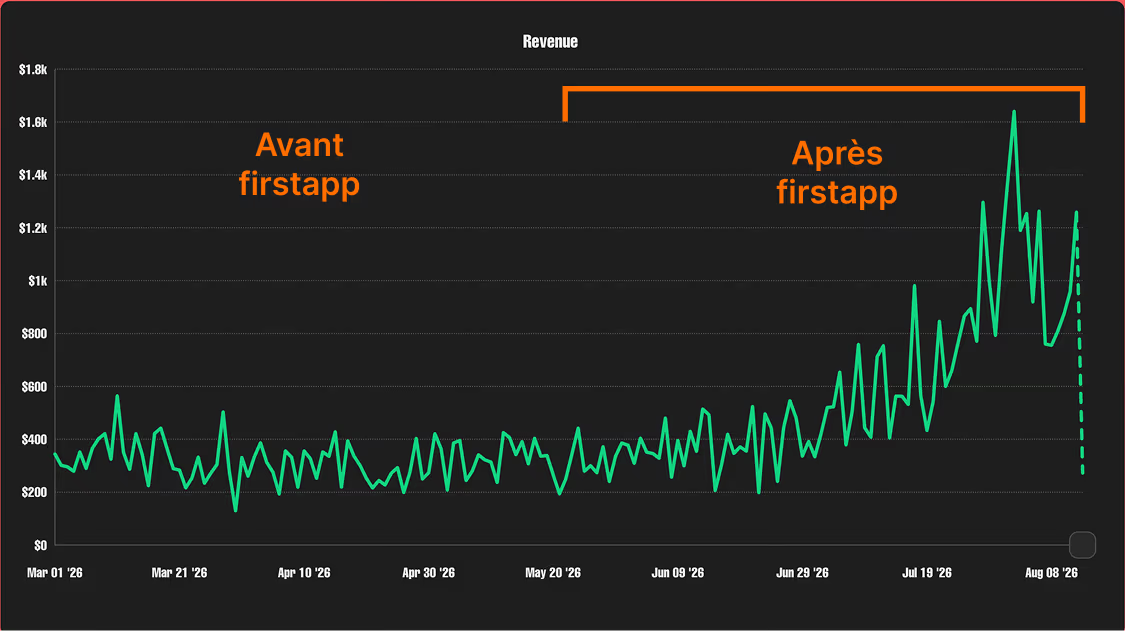
Our mobile experimentation framework
At firstapp, we apply this loop on every B2C app we optimize. Our method can be summed up in seven steps:
DATA → PROBLEM → HYPOTHESIS → PRIORITIZATION → EXPERIMENT → MEASUREMENT → LEARNING
Then the loop starts again. Each experiment should reduce part of the uncertainty we have about the product.
1 - Instrument the app properly
Before testing anything, you have to be able to measure what is happening.
A monetization funnel can look like this, for example:
| Step | Event |
|---|---|
| Install | install |
| Onboarding started | onboarding_started |
| Onboarding completed | onboarding_completed |
| Paywall viewed | paywall_viewed |
| Trial started | trial_started |
| Subscription started | subscription_started |
| Renewal | renewal |
Each step has to be instrumented correctly. But events alone are not enough.
We also want to be able to analyze users along different dimensions:
- acquisition source;
- country;
- platform;
- campaign;
- cohort;
- subscription type;
- behavior;
- tenure.
An overall conversion of 4% can look interesting.
💡 Key data : If users coming from TikTok convert at 1.5% and those coming from organic at 7%, we probably do not have a single problem. We have several segments with different behaviors.
Good experimentation therefore starts with good instrumentation.
2 - Identify the problem
A metric tells us where to look.
It does not necessarily tell us why.
Take an example: only 20% of users see the paywall.
The instinctive reaction could be:
"The paywall needs to be shown earlier."
But we have already jumped to a solution. We first need to understand what is happening.
To do that, we can cross quantitative data with:
- App Store reviews;
- user interviews;
- support tickets;
- recorded sessions;
- feedback;
- cancellation reasons.
The goal is to turn a quantitative anomaly into an understandable problem.
| Step | Example |
|---|---|
| Observation | Users drop off massively from onboarding at step 5. |
| Investigation | Step 5 asks for account creation before the user has really understood the app's value. |
| Potential problem | Account creation comes too early. |
We now have a question we can test.
3 - Formulate a hypothesis
We use a simple structure:
💡 Template : We believe that [problem] prevents [segment] from [action].
We are going to test [change].
We believe this will increase [metric].
Example:
We believe that account creation too early in onboarding creates friction before the user understands the value.
We are going to move account creation to after the first moment of value.
We believe this will increase the onboarding completion rate.
The difference can seem subtle. But it is fundamental.
We are not testing:
"a new onboarding".
We are testing:
the hypothesis that a specific friction prevents activation.
4 - Prioritize the experiments
A team can easily have 30 or 50 test ideas.
It probably does not have the capacity to launch 50 of them. So we have to prioritize.
A simple method is to use:
ICE = Impact × Confidence / Effort
| Criterion | Question |
|---|---|
| Impact | What would the business impact be if the hypothesis is correct? |
| Confidence | How much data supports this hypothesis? |
| Effort | How long does it take to design, build, and ship the experiment? |
This avoids a classic trap: spending three weeks building a test whose potential impact is low, while another experiment could be launched in two days.
The speed of experimentation also depends on the ability to choose the right tests.
5 - Design and launch the experiment
An experiment has to be defined before it is built. We define in particular:
| Element | Role |
|---|---|
| Control | The current experience. |
| Treatment | The new experience. |
| Audience | The users who will be eligible for the test. |
| Primary metric | The main metric that will let us evaluate the hypothesis. |
| Secondary metrics | The complementary metrics. |
| Guardrails | The metrics that must not get worse. |
For example, for a new paywall:
| Field | Example |
|---|---|
| Hypothesis | A clearer value proposition will increase conversion to trial. |
| Primary metric | Paywall view → Trial start |
| Secondary metrics | Install → Trial Trial → Paid Revenue per install |
| Guardrails | Refund rate D7 retention Cancellation rate |
This avoids treating as a winner an experiment that lifts an intermediate metric but hurts revenue or retention.
6 - Measure the right impact
An A/B test should not only measure what happens on the screen being tested.
Take a paywall. Variant B increases the trial-start rate by 25%. That looks excellent.
⚠️ Warning : If users of this variant then convert less well into paid subscriptions, the result can be negative for the business.
So we want to look at the full chain:
Paywall view → Trial start → Trial to paid → Revenue per install → LTV
Depending on the context, we can track:
- conversion;
- revenue per user;
- revenue per install;
- ARPU;
- retention;
- churn;
- renewal;
- LTV.
The right metric is the one that matches the business goal of the experiment.
7 - Turn results into learnings
A test should never end with:
B wins +12%.
We want to know:
Why?
| Result | What we do with it |
|---|---|
| The test wins | Understand what caused the improvement, then formulate a new hypothesis. |
| The test loses | We have potentially invalidated a hypothesis. That is information too. |
| Inconclusive | Part of our understanding of the problem is still insufficient. |
In all three cases:
Result → learning → new hypothesis → new test
This is the loop that creates cumulative progress.
What can you test on a mobile app?
Experimentation is not limited to the paywall. We generally look at several large zones of the funnel.
| Zone | Goal |
|---|---|
| ASO | Impression → visit → install |
| Onboarding | Install → activation → monetization |
| Paywall | Paywall view → trial / paid |
| Pricing & packaging | Conversion, but above all revenue and LTV |
| Retention | Renewal, churn, LTV |
ASO
The App Store is the first conversion step.
You can experiment with:
- the icon;
- screenshots;
- screenshot order;
- messaging;
- the value proposition;
- localization;
- Product Pages.
Goal: impression → visit → install.
Onboarding
Onboarding has to turn an install into understanding, then into activation. To go further: how to optimize a mobile onboarding.
You can test:
- number of screens;
- order;
- personalization;
- quiz;
- account creation;
- the moment of the first "aha moment";
- messaging;
- paywall timing.
Goal: install → activation → monetization.
Paywall
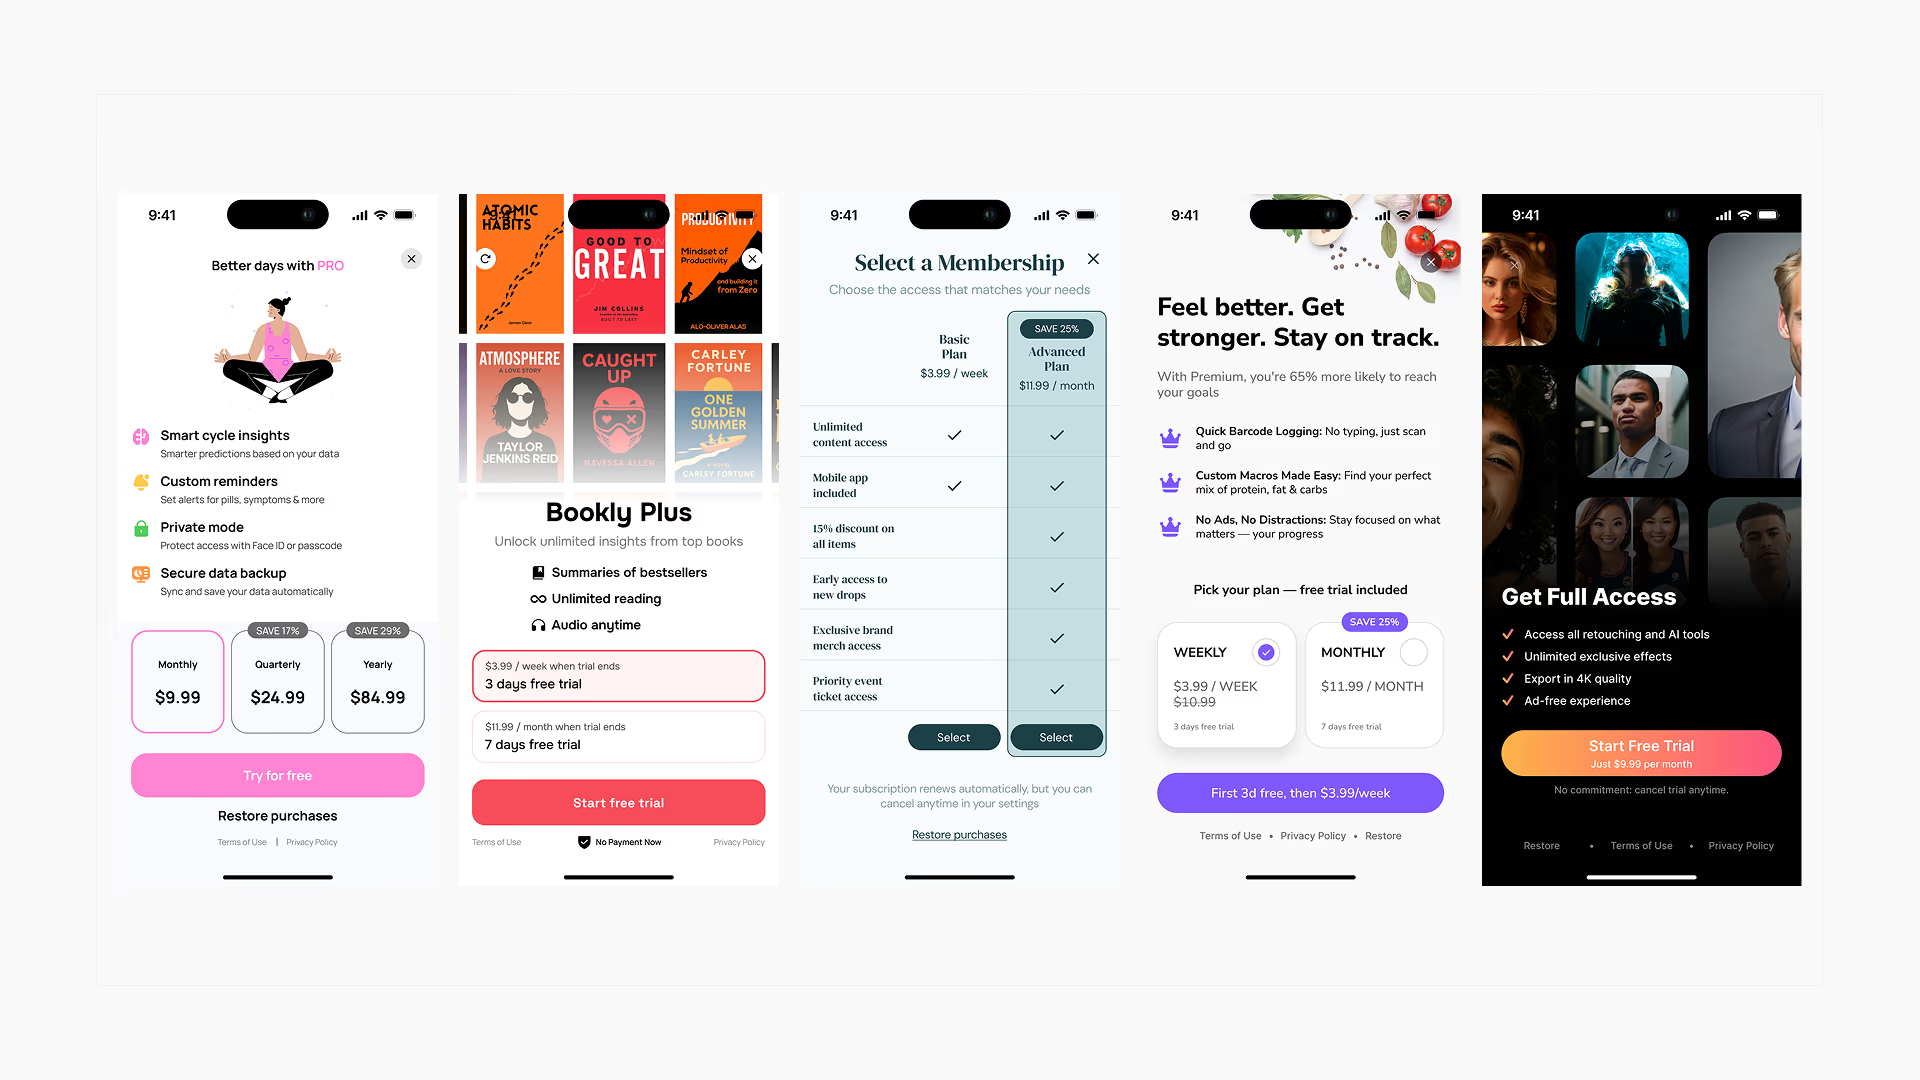
The paywall is not just its design. See also how to optimize a mobile app paywall.
You can test:
- placement;
- timing;
- structure;
- messaging;
- CTA;
- benefits;
- social proof;
- number of plans;
- offer;
- personalization.
And above all:
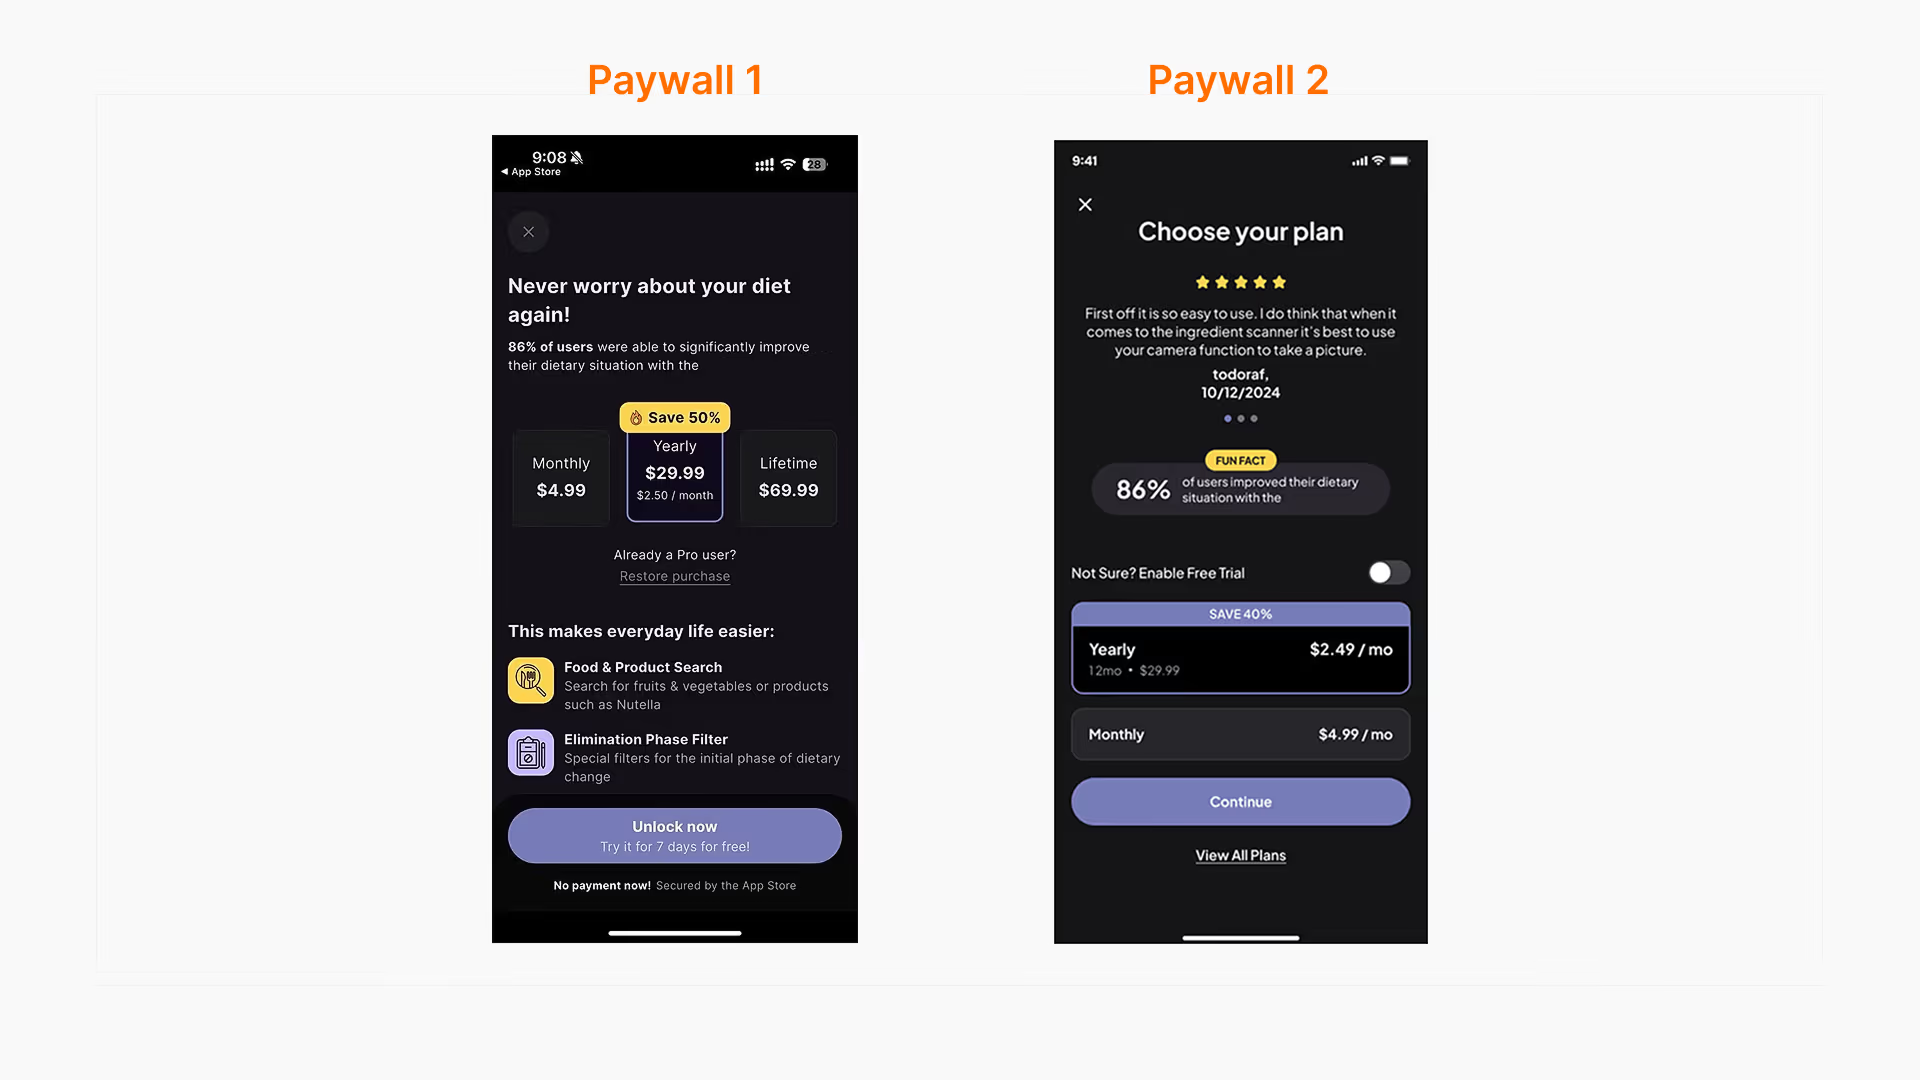
⚠️ Warning : The best paywall for an app is not necessarily a competitor's.
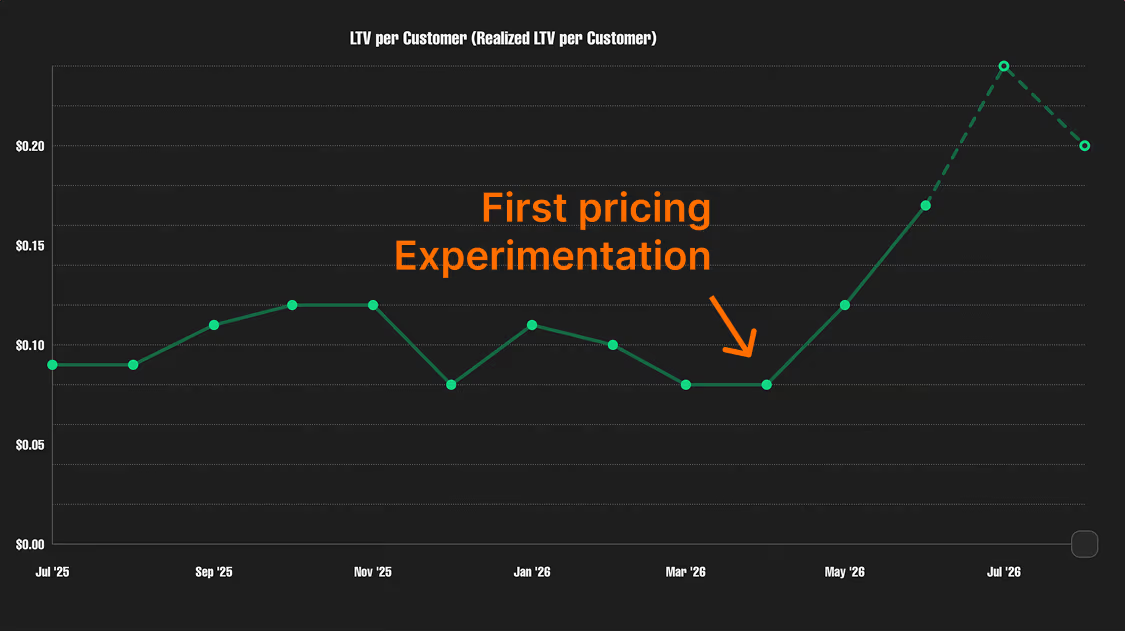
Pricing & Packaging
The price itself is an experimentation variable.
You can test:
- price;
- monthly vs annual;
- trial length;
- presence or absence of a trial;
- lifetime;
- bundles;
- entry offers;
- pricing by country.
A price increase can lower the conversion rate while increasing revenue. That is why:
Conversion ≠ Revenue
Revenue ≠ LTV
You have to look at the metric that matches the real business goal.
Retention
Optimization does not stop at the first payment. On churn: how to reduce cancellations.
You can experiment with:
- post-purchase onboarding;
- activation;
- notifications;
- value reminders;
- engagement;
- cancellation flow;
- retention offers;
- win-back.
A user who cancels also gives us information.
Why did they leave? That answer can become the next hypothesis to test.
How to avoid the main experimentation biases
| Bias | What happens | Solution |
|---|---|---|
| Confirmation | You think variant B is going to win, and you read every signal as confirmation. | Define the hypothesis and the success criteria before the test. |
| Competitive | You see a competitor do something and assume it works. | Start from your own data first. |
| Multiple testing | You change five variables at the same time. | Reduce the number of variables when you are trying to understand a cause. |
| Metric fixation | You optimize a metric because it is going up. | Define a primary metric and guardrails tied to the business. |
| Vanity metrics | You look at a metric because it is easy to improve. | Tie every experiment to a business goal: Revenue → Conversion → Retention → LTV. |
The speed of learning is a competitive advantage
A large part of the subject can be summed up with a simple formula:
Speed of learning = quality of the hypotheses × speed of execution × quality of measurement
If you have excellent hypotheses but it takes three weeks to launch each test: you learn slowly.
If you ship very fast but test at random: you produce a lot of noise.
If you have good hypotheses and fast execution but poor instrumentation: you do not know what works.
The three have to work together.
Our experimentation method in one loop
In the end, everything comes back to this:
Measure → experiment → learn → improve
A B2C app should not be treated as a "finished" product.
It should gradually become a system able to measure, experiment, learn, and improve.
A roadmap should therefore not only answer:
"What are we going to build?"
It should also answer:
"What are we going to learn?"
That is the difference between building an app and building an app you know how to move forward.
Learn faster, not test more
A good mobile experimentation strategy is not about multiplying A/B tests.
It is about building a system where every experiment has a reason to exist.
The goal is not to test more. The goal is to learn faster what actually moves your app forward.
If you already have a B2C app and you do not know which levers to prioritize, ASO, onboarding, paywall, pricing, conversion, or retention, we can start by analyzing your funnel and identifying the first hypotheses to test.
FAQ - Mobile experimentation
What is mobile experimentation?
It is a method that uses data and tests to identify what actually improves a mobile app's performance.
What can you test on a B2C app?
You can experiment across almost the whole funnel: ASO, onboarding, paywall, pricing, offers, conversion, and retention.
Do you need a lot of users to do A/B testing?
Not necessarily. The volume you need depends on the metric, the conversion rate, and the impact you are looking for. With little traffic, some qualitative tests or targeted changes can be more relevant.
How long should an A/B test last?
There is no universal duration. It depends in particular on traffic volume and on how fast users reach the primary metric. What matters is defining the analysis criteria before launching the test.
Should you test only one thing at a time?
When the goal is to identify a cause-and-effect relationship, isolating the variables makes interpretation much easier. Testing too many changes at once can make the results hard to attribute.
What is the best place to start?
With the funnel. First identify the step that represents your biggest improvement potential, then try to understand why users drop off there.
Also read

How do I optimize my mobile app?
65% of mobile apps are uninstalled within 24 hours, while in-app purchases passed $167 billion in 2025. The gains come from targeted fixes on the onboarding, the paywall, and ASO.

Mobile app metrics: the essential KPIs to track
A mobile app's metrics group into acquisition, activation, retention, and monetization. Median retention is 25 to 30% at D1, and median 1-year RLTV is $23.